I just tweeted this, but here’s the chart:
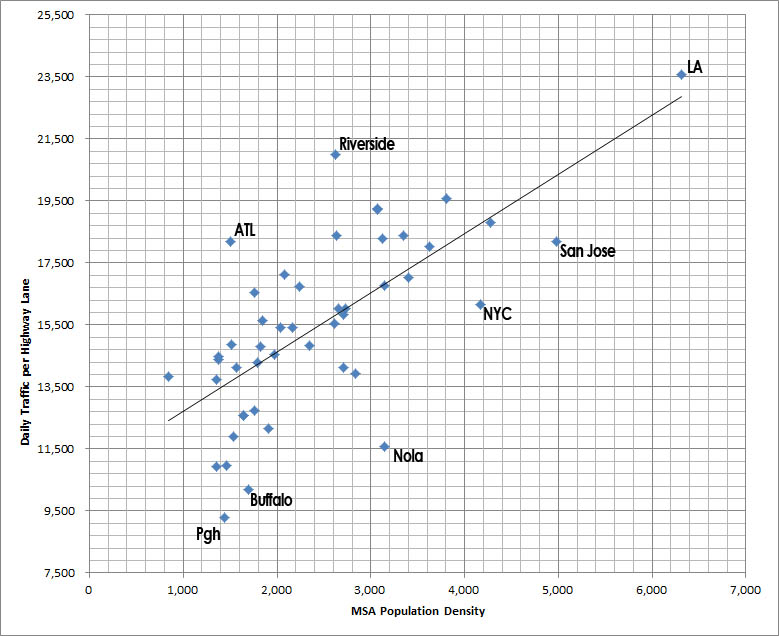
I only used the top 50 MSAs for this one, if only for expedience. This shows daily traffic per highway lane on the y-axis and population density on the x-axis. In general, there is a direct relationship between more dense places and more highway congestion. Duh.
But there is also quite a bit of noise in the data, that is often regionally affected. Rustbelt metros tend to be low/low (density/congestion). Sprawling sun belt cities tend to be low/high, towards the top left portion of the graph. LA, the anomaly that it is, is high/high.
Ideally, a city wants to trend towards the bottom right of the graph or higher density/lower congestion, meaning higher tax base and lowered highway infrastructural wear/tear/burden. In theory, that tax base can then be put to better use, amenity, schools, police, etc.
However, without charting international cities, it is difficult to determine whether high/low is even possible without the complete removal of freeways altogether. Where would Vancouver fit on this chart? London?
The basic issue however is that cities get more congested the denser they get. Or, better said, their highway lanes get more congested (if they have them at all, a la Vancouver). Attempting to alleviate congestion by adding highway lanes only serves to lessen density and, in turn, the tax base to support that new infrastructure.
The only way to maintain density (or add it as the case may be) while decreasing congestion is to get people out of cars, through improved alternative networks plus the reduction of highway lanes.