Playing around with the data tables a bit, I wanted to look for more identifiable connections between connectivity (or lack thereof) and the highway. Something I hadn’t yet graphed was the cross-section of connectivity. It ends up looking like this:
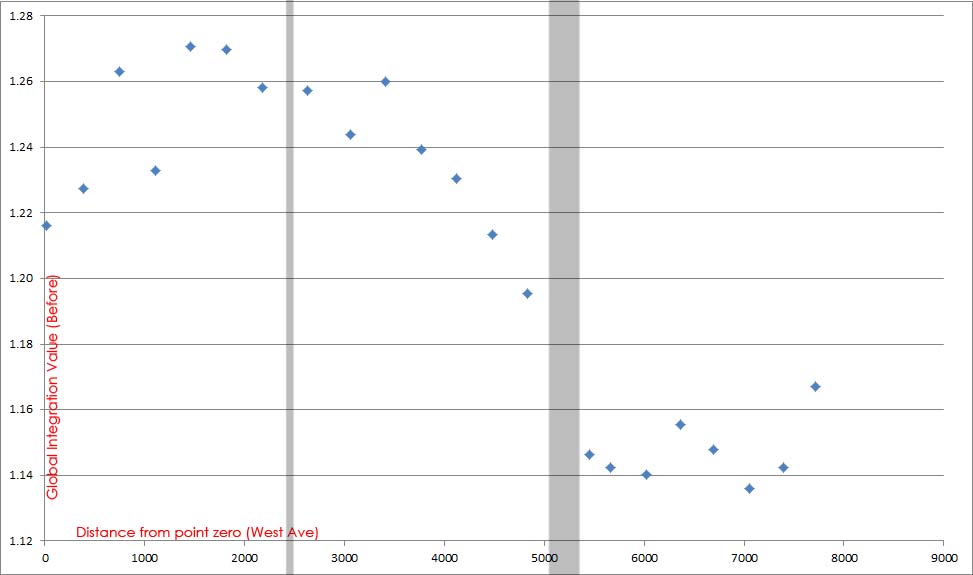
Again, that is just connectivity as measured by the spatial integration map for global interconnectivity of Austin before the cut n cap. There aren’t dollar values set to this, but…it looks an awful lot like land value per square foot of what is existing, no?
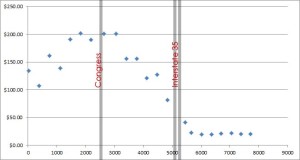
Again, the immediately above graph shows only existing land value per square foot to the same cross-section based on distance from West Ave (point zero). The same patterns exist: a steep drop-off from Congress to I-35 and a relatively flat value disconnected as if it was totally apart, disembodied from its relationship to downtown and any possible increment that could be interpreted based on proximity to downtown, downtown amenities, and jobs.
When looking at the 1st graph in a different way, rather than distance from West Ave but distance from I-35 itself, it paints a stark contrast in the drop in value between one side of the highway and the other.
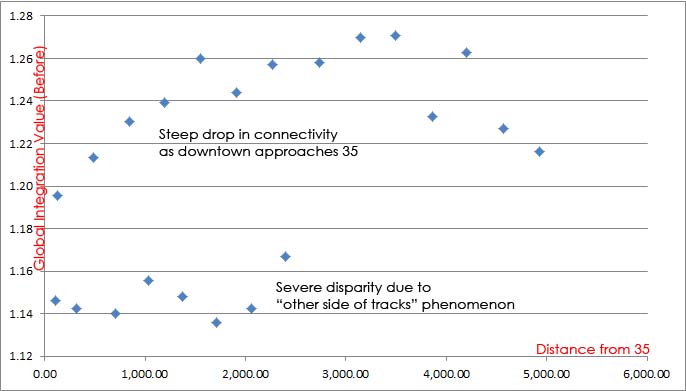
New potential “value-capture” (and yes I hate that term but people understand it) exists by removing or cutting and capping 35 on both sides of the highway, smoothing out the steep decline as properties approach 35 as well as much of East Austin.