In the spirit of March Madness, the Atlantic Cities created their own tournament bracket for what their deeming the “urbanist toolkit.” It’s certainly not comprehensive, but I suspect what was on the top of somebody’s head needing to fill empty spaces on a 32 “team” tournament. Nor would I say it’s the 32 best, but rather a range of topical (I guess) urbanist interventions.
It’s primary problem is that it’s basically just a popularity contest. The danger of taking crowdsourcing a bit too far and too seriously. Yes, there is wisdom in crowds, however as Churchill said, “Americans will eventually get it right after first exhausting all other possible solutions.” Or as Super Hans said, “you can’t trust people. People voted for the Nazis and listen to Coldplay.” Somewhere in their lies kernels of truth in human nature and why the founding fathers ended up with a republican form of democracy rather than true democracy. Or as Plato deemed, “mob rule.”
With urbanist interventions, the rise of grass roots implementation efforts, and an increasing interest in the physical environment around us, popularity is ephemeral and tends to be wedded to a specific time and place. A flavor of the month.
Therefore, like the actual basketball tournament isn’t a popularity contest but intended to be a competition of quality and skill, I wanted to add a different layer of interpretation to the Atlantic Cities brackets. Power ratings, if you will.
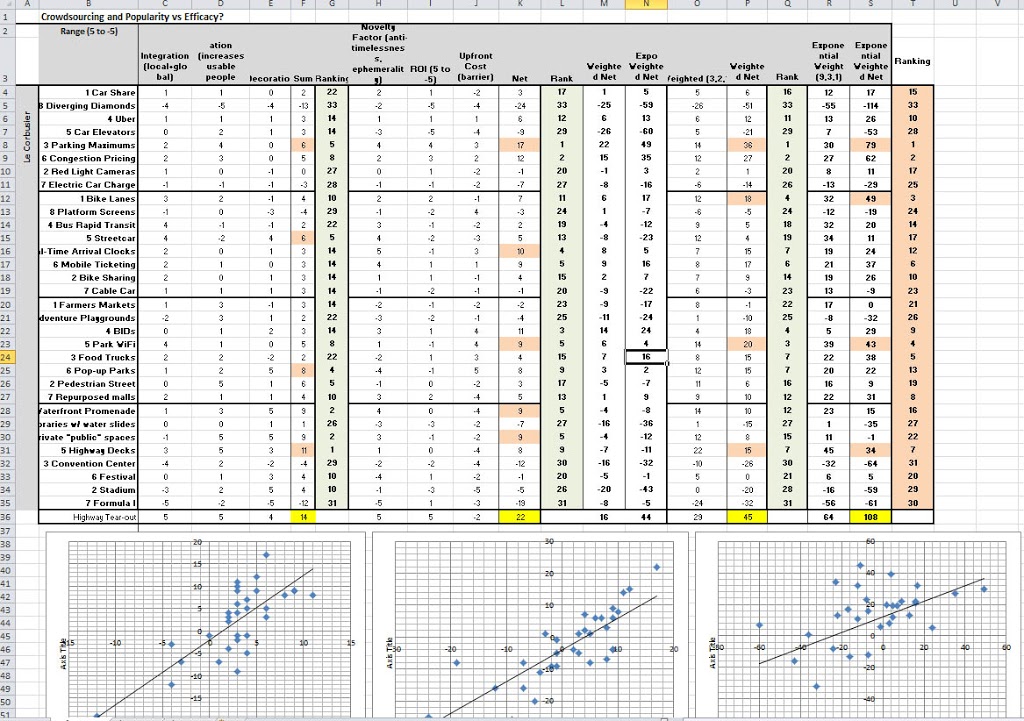
An admitted weakness of this and all evaluations of these interventions is finding apples to apples comparisons. It’s inherently going to be rather subjective. Because it will be virtually impossible to find solid, scientific data related to each aspect I wanted to evaluate, I’m resorting to a range from -5 to +5 for each category. And yes, it’s my interpretation of what constitutes +5 and -5.
The four major Categories I evaluated the brackets with were:
- Value Created (consisting of my Integration, Accommodation, and Decoration sub-categories)
- Costs Associated (consists of novelty or ephemerality, Upfront Costs or barriers, and Return on Investment)
- Net Linear Weighting (Value minus Costs using 3,2,1 as integers) – for Value Integration received highest weight, Decoration lowest; for Costs, ROI gets highest weight and novelty the lowest)
- Net Exponential Weighting (Value minus Costs using 9,3,1 as integers) – same hierarchy of weighting
As of right now, the Atlantic Cities popularity bracket has been narrowed down to an elite eight by “regional” with the remaining survivors being: Car Sharing, Congestion Pricing, Bike Lanes, Real-time Clocks, Farmers Markets, Pedestrian Streets, Waterfront Promenades, and Festivals.
Before we see how these fair against my criteria, I’ll just hypothesize right now that farmers markets, pedestrian malls, waterfront promenades, and festivals are overrated in the Platonic sense. They sound more beneficial than they actually are.
Let’s stack them up shall we:
VALUE CREATED (will tend to favor decoration):
Final Four (winner): Parking Maximums 6, Streetcar 6, Pop-up Parks 8, Highway Decks 11
Top 3 Overall (in order): Highway Decks (11), Waterfront Promenade (9), Private Public Space (9)
Last: Diverging Diamonds -13
COSTS (Best bang for buck?):
Final Four (winner): Parking Maximums 17, Real-time Arrival Clocks 10, Park WiFi 9, Waterfront Promenade 9/Private Parks 9 (tie)
Top 3 Overall (in order): Parking Maximums (17), Congestion Pricing (12), Real-time Arrival Clocks (10)
Last: Diverging Diamonds -24
LINEAR WEIGHTED NET (favors interconnectivity and ROI):
Final Four (winner): Parking Maximums 36, Bike Lanes 18, Park WiFi 20, Highway Decks 15
Top 3 Overall (in order): Parking Maximums (36), Congestion Pricing (27), Park WiFi (20)
Last: Diverging Diamonds -51
EXPONENTIAL WEIGHTED NET (really favors interconnectivity and ROI:
Final Four (winner): Parking Maximums 79, Bike Lanes 49, Park WiFi 43, Highway Decks 34
Top 3 Overall (in order): Parking Maximums (79), Congestion Pricing (62), Bike Lanes (49)
Last: Diverging Diamonds -114
Notes:
- The elite 8 of the AC’s popularity contest doesn’t fair as well here. Only congestion pricing, bike lanes, and real time clocks make an appearance here or there. The four I predicted would be overrated, farmers markets, pedestrian malls, waterfront promenades, and festivals, actually were. They finished 21st, 19th, 16th, and 20th respectively out of 32.
- Unsurprisingly, exponentially rated results are nearly identical to linearly weighted, with the only change being that bike lanes worked their way into the top 3 overall replacing Park WiFi mostly because bike lanes generate more economic value.
- Parking maximums scored well in every major category, winning three of four and only losing Value Created where it finished 5th of 32 despite winning its regional. It fares well by creating effective change at relatively minimal costs. Especially because maximums can be implemented locally and by district rather than citywide like congestion pricing, the barriers are lower.
- Here’s a list of interventions that scored in negatives in exponentially weighted net value minus costs (my preferred ranking) besides Diverging Diamonds which finished last in every category (as highway/arterial interchange spaghetti predictably should): Car Elevators, Platform Screens, Cable Car, Adventure Playgrounds, Libraries w/ Waterslides (wtf?), Private parks, Convention Centers, Stadiums, and Formula I
- In the screen grab above, you can see where I charted the various ranking aspects, value on one axis, costs on the other. The most interesting thing to me was the amount of noise increased with the increased weighting. Perhaps because it generated bigger numbers, but I had presumed it would help clarify and streamline the data, and have a lower r-squared value. The opposite occured and I’m guessing that had to do with the significant disparity between financial costs/financial benefits and financial costs/urban and interconnective benefits. Yeah, there is some relationship, but it’s noisy.
——————
As I said previously, the Atlantic Cities list isn’t comprehensive. And for this exercise I only used what they provided. So I decided to toss a stick of dynamite into the mix by way of Highway Tear-outs. And guess what, it won every major category listed above (despite scoring poorly in a few sub-categories like upfront costs/barriers. Actually, that’s the only negative score it accrued).
Highway Tear-out (score of next highest)
Value: 14 (11)
Costs: 22 (17)
Linear Weighted Net: 45 (36)
Exponential Weighted Net: 108 (79)
Does that reveal my biases? Possibly. Probably. Or does it suggest that my biases are constructed upon strong urbanist understanding and principals and by favoring highway tear-outs? I merely accurately predicted a bracket based on intervention efficacy power rankings. And based on the metrics (that yes, I established according to my values) it wins. Of course, can you really argue that highway tear-outs DON’T create the most value while generating the most ROI?