I’ve made a few graphics regarding traffic on Downtown Dallas streets related to the capacity they’re built for. Maybe you’ll find them as interesting as I do.
The caveat of course is that traffic capacity on a street varies by whether you are measuring by minute, by hour, or by day. Daily traffic capacity assumes not many people are going to be out and about driving at 4 am while most people will be driving during rush hours. These variables make for some margin for error. However, I have 2015 traffic counts per day and theoretical capacities based on street size, whether one-way or two-way, etc also per day. Therefore, you get what I’ve got. All progress is a slow slog towards slightly better data.
The below graphic is daily traffic for every street downtown. The width of the street segment block to block is scaled to the amount of cars it moves per day. With that said, I don’t necessarily view ‘traffic’ as a bad thing. It’s a bad thing if it is all in cars, it’s all moving dangerously fast, and there is no functional interface between the public and private realms. Otherwise, traffic viewed holistically as all forms of movement equals value.
The classic comparison I make is that 635 moves 250,000 cars per day while Champs Elysees moves 80,000 (at each ‘checkpoint’), but also moves a million pedestrian and transit riders combined on the sidewalks and the 1 line below. Since it moves so many people while offering an interface (storefronts) between slow moving local traffic (the pedestrians), it has 10x the per square foot real estate value as does 635 in half the right-of-way.
In other words, if there isn’t much traffic, there isn’t much value. Of course, traffic and economic activity are interrelated, qualitatively and qualitatively, in vicious or virtuous circles. Movement begets value which begets more movement. If that movement ever becomes overbearing, crowded, or otherwise undesirable then too much traffic can begin having a negative effect. Think of a road full of honking unmoving cars or people getting shoved into a Tokyo subway car.
On the other hand, look at Van Ness in San Francisco or Michigan Ave in Chicago that move more than double the vehicular traffic that any street in downtown Dallas moves.
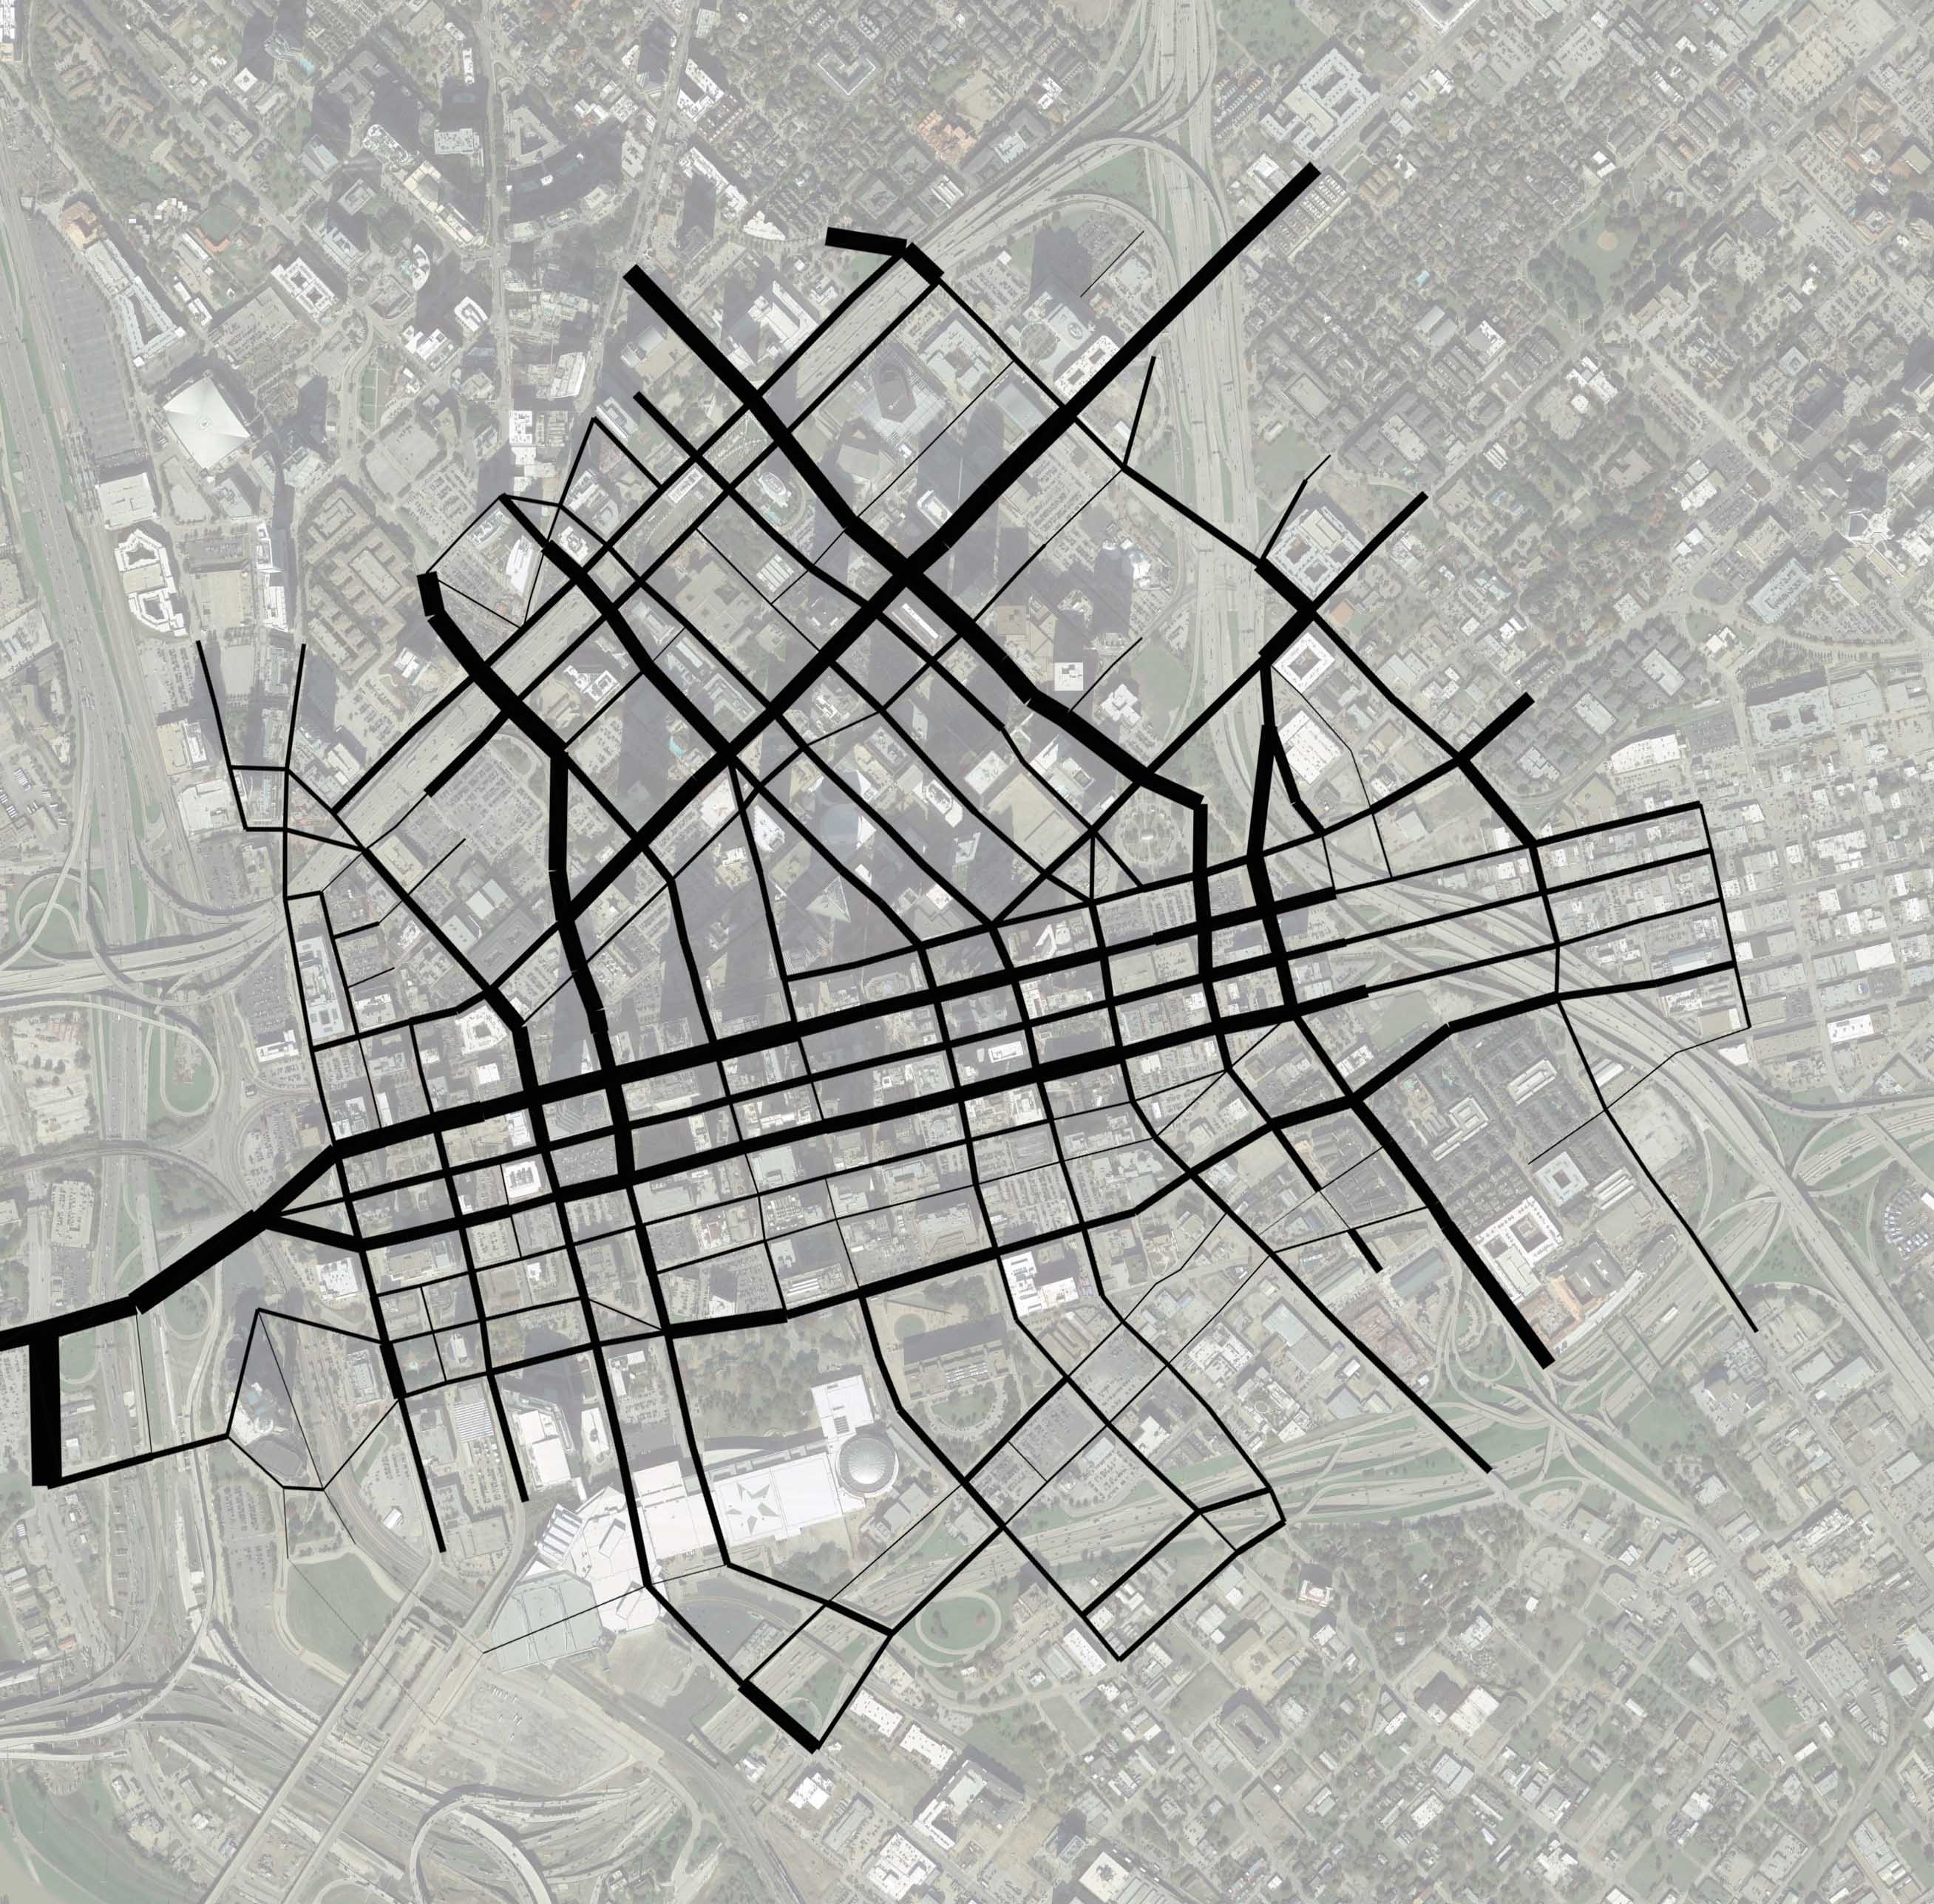
You’ll see the highest traffic counts (the widest segments) are the areas around the Ross and Pearl Intersection, Elm Street headed to 35, and the Griffin/Field corridor. While Pearl and Ross do feed to/from highways, they are less the escape routes that Elm and Griffin/Field are, suggesting Pearl and Ross have high value potential (they already do, but potentially moreso with some ‘urbanizing’ improvements).
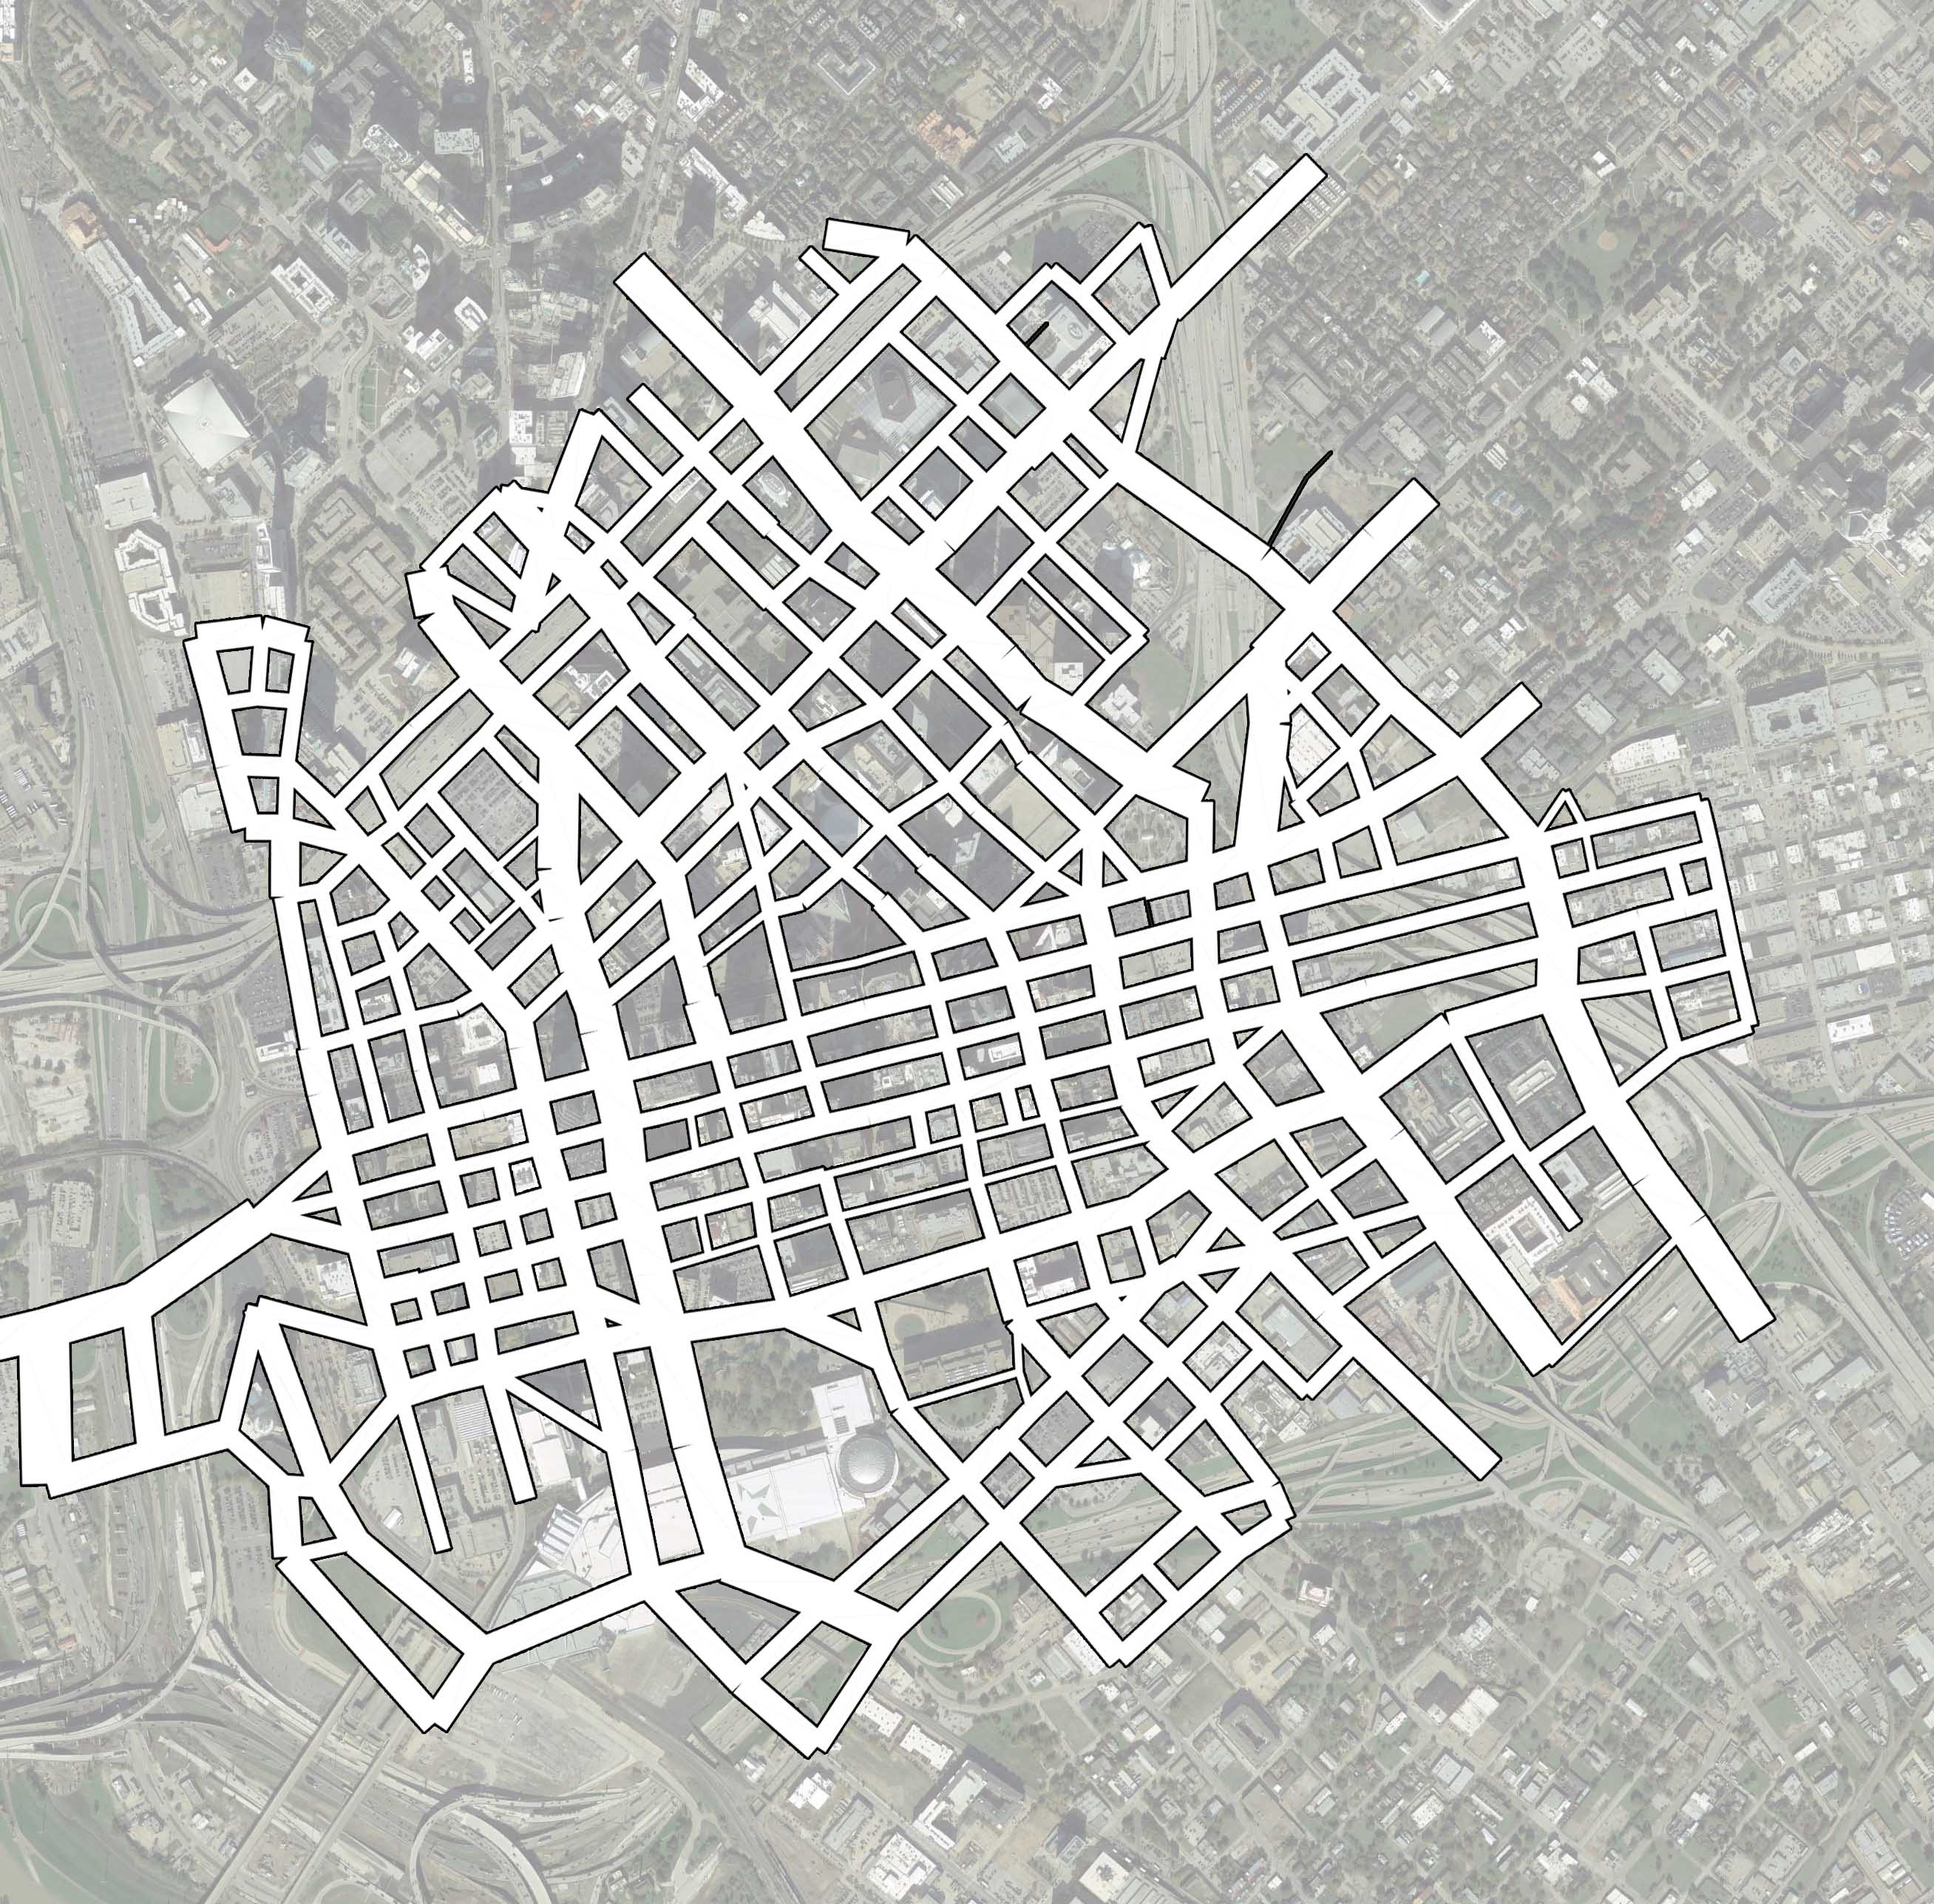
And below is the theoretical daily capacity of the same streets. There are some big’uns, the widest are all the scale of Van Ness and Michigan Aves mentioned above. While the scale of the road is a factor, that doesn’t necessarily make it urban or dis-urban as much as its design and its connectivity and centrality within the context of the larger network. I’ve previously compared Ross Avenue to Champs Elysees based on where these axes exist within their network. In essence, they’re the long straight roads that all roads intersect with. Again, suggesting Ross Avenue has a lot of unmet potential (we should be more careful what kind of buildings we allow to be built on it).
Since these two diagrams can only say so much on their own, besides that the street network is highly irregular, it is worth overlaying traffic onto capacity as shown below.
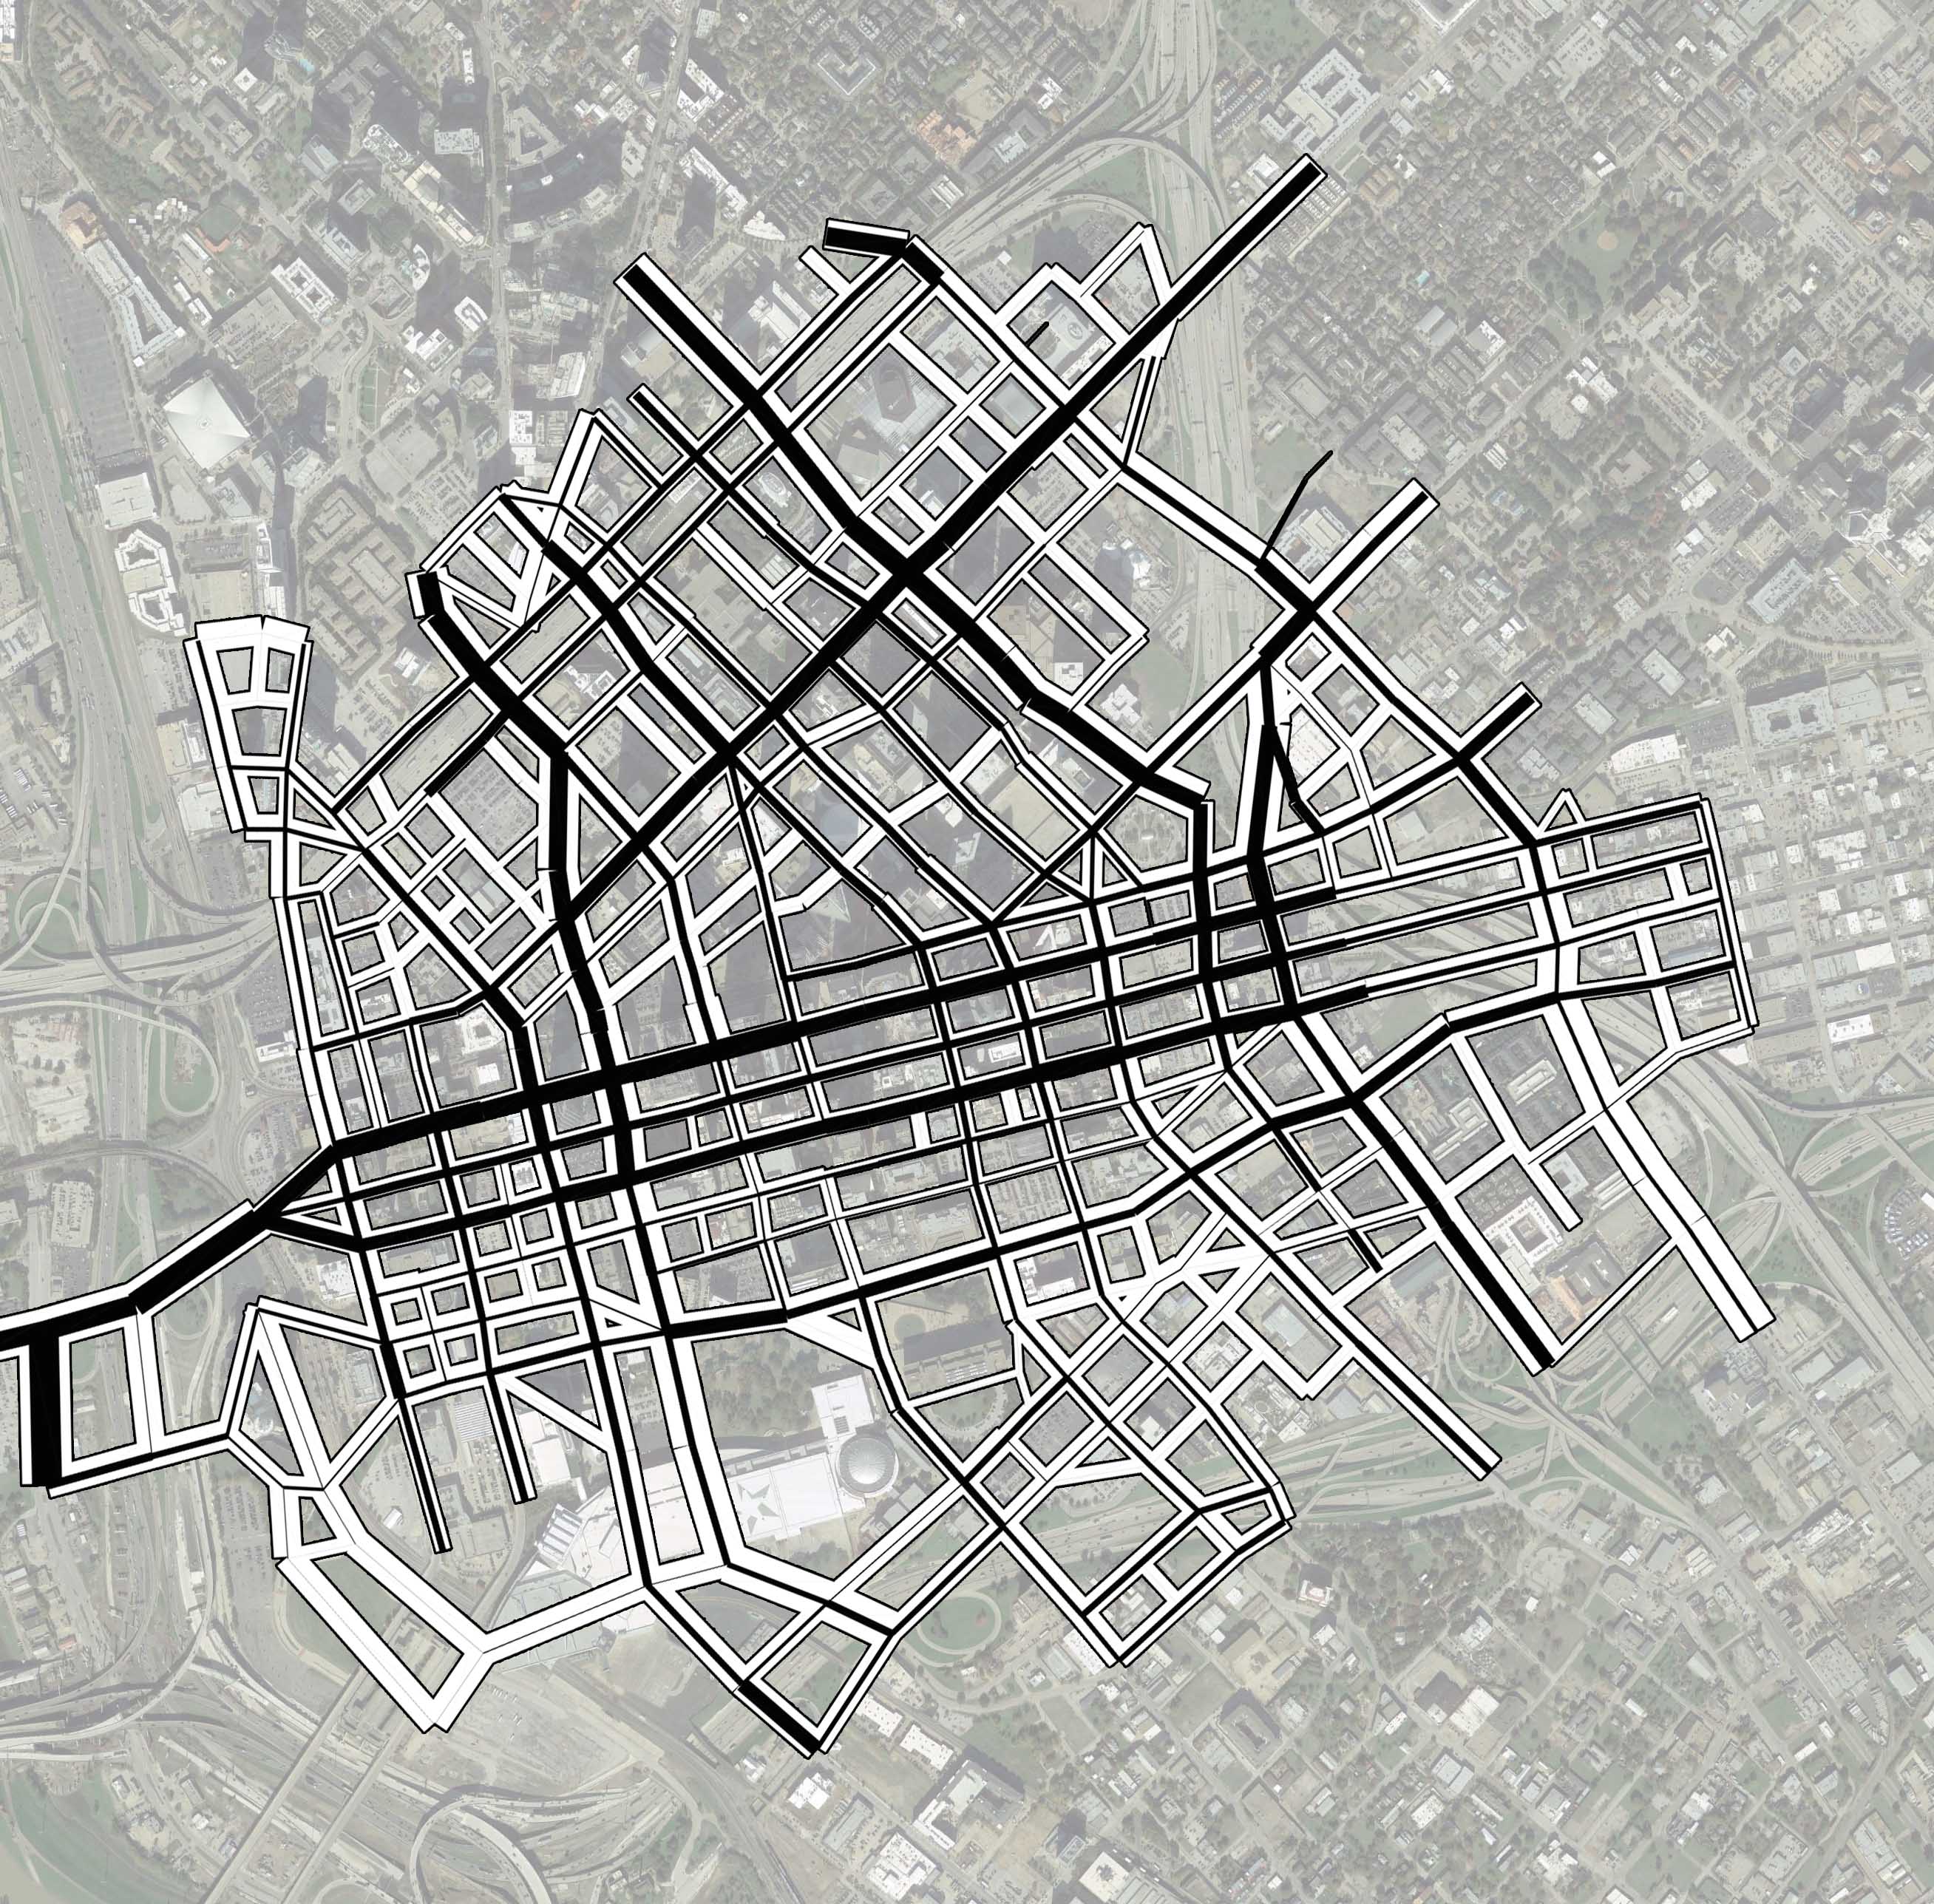
There is more parsing to be done that simply saying roads that are full of cars are good or bad or that roads that are over-scaled and empty should immediately be downsized. Further exploration is necessary to determine if the traffic is adding value or the larger system has created a choke point. Is that traffic there to interface with the buildings on that street or is it an escape route? The nature of limited access highways creates these choke points. It’s the funnel vs. the filtering of traffic that highly interconnected grid systems do.
On the other hand, the empty streets may be empty because they are disconnected from the broader system, or there is little economic activity there, or the design of the street, its size, scale, speed, and disconnected nature might have undermined previous economic activity and desirability.
Let’s look at this data a different way, as a heat map of traffic as a percentage of capacity.
(if you click on the graphics you can see them at a higher resolution. There is some compression occurring in the publishing process that makes them a bit fuzzy)
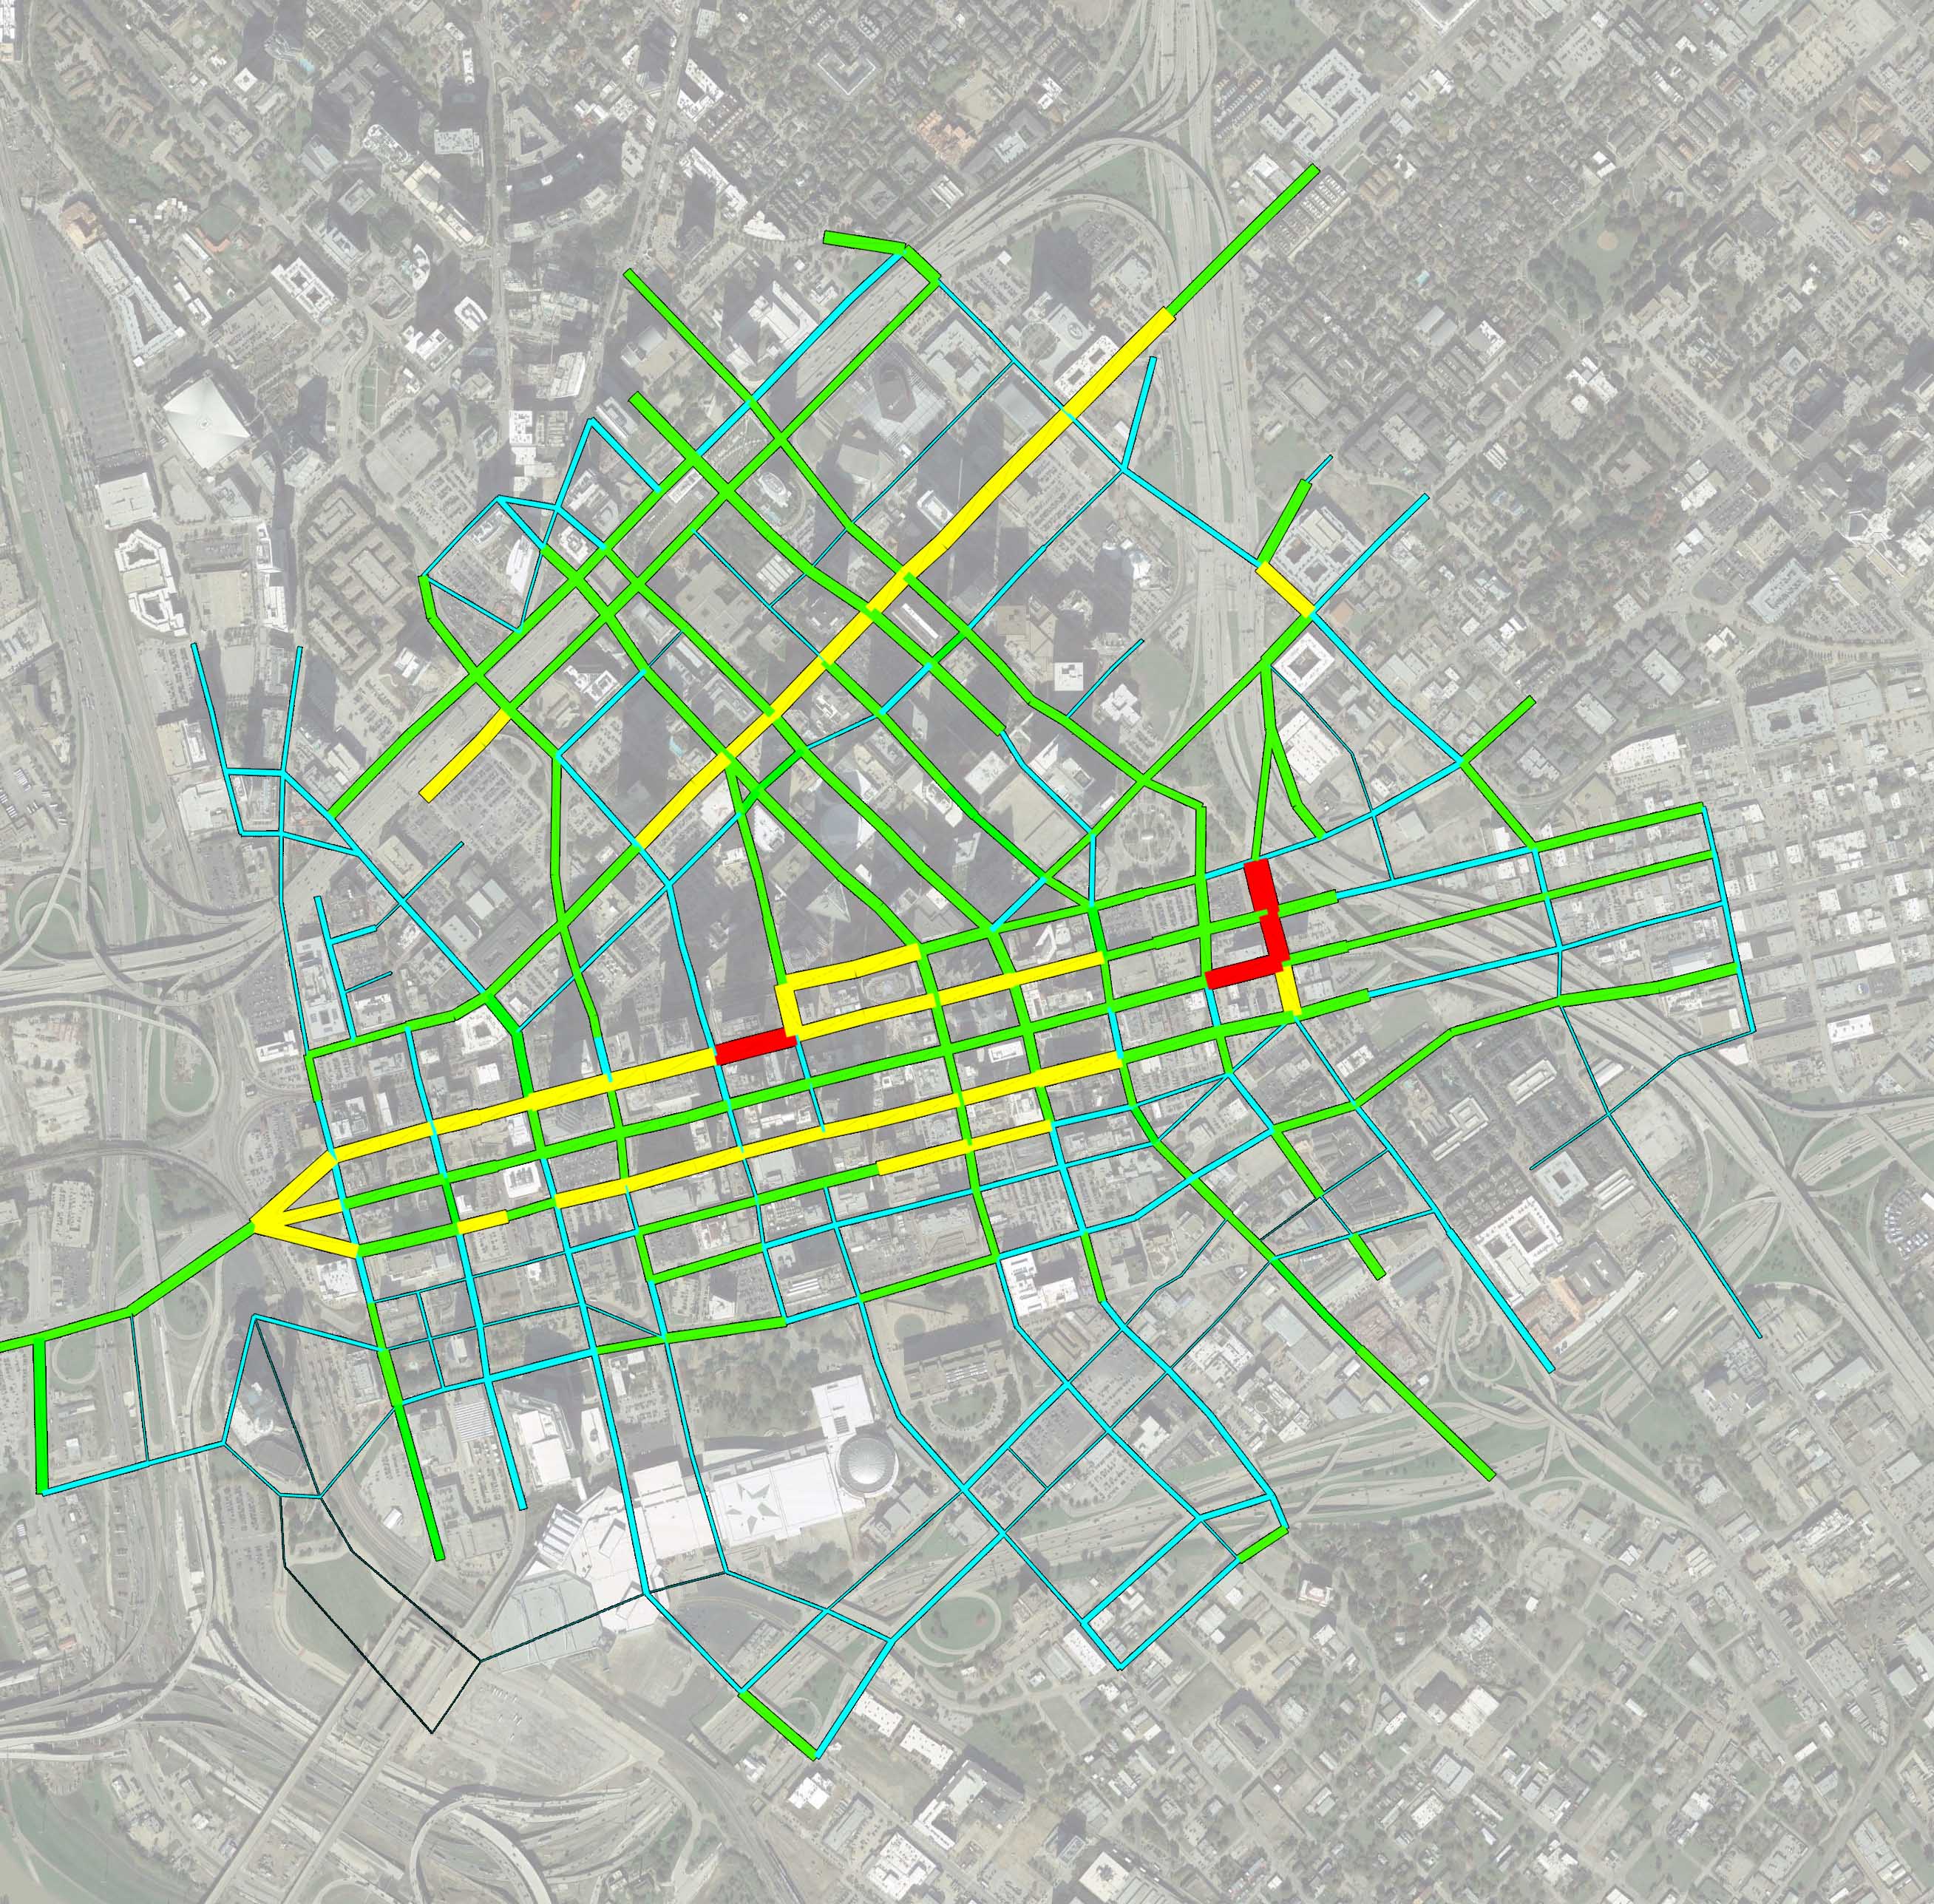
Red is at or over 100% of capacity. Remember, daily capacity accounts for lower traffic off-peak hours, so if a road is busy beyond just peak AM and peak PM hours, it can easily tip over this ‘theoretical’ capacity. This ‘main street’ in Michigan moves 150% of what it theoretically should. The relationship of street size, speed, and relationship to the private realm is also why road diets often lead to an increase in traffic even though the road gets smaller. There is more reason to go there.
Yellow segments are 70-100%. Green are 40-70% and Blue is below 40%.
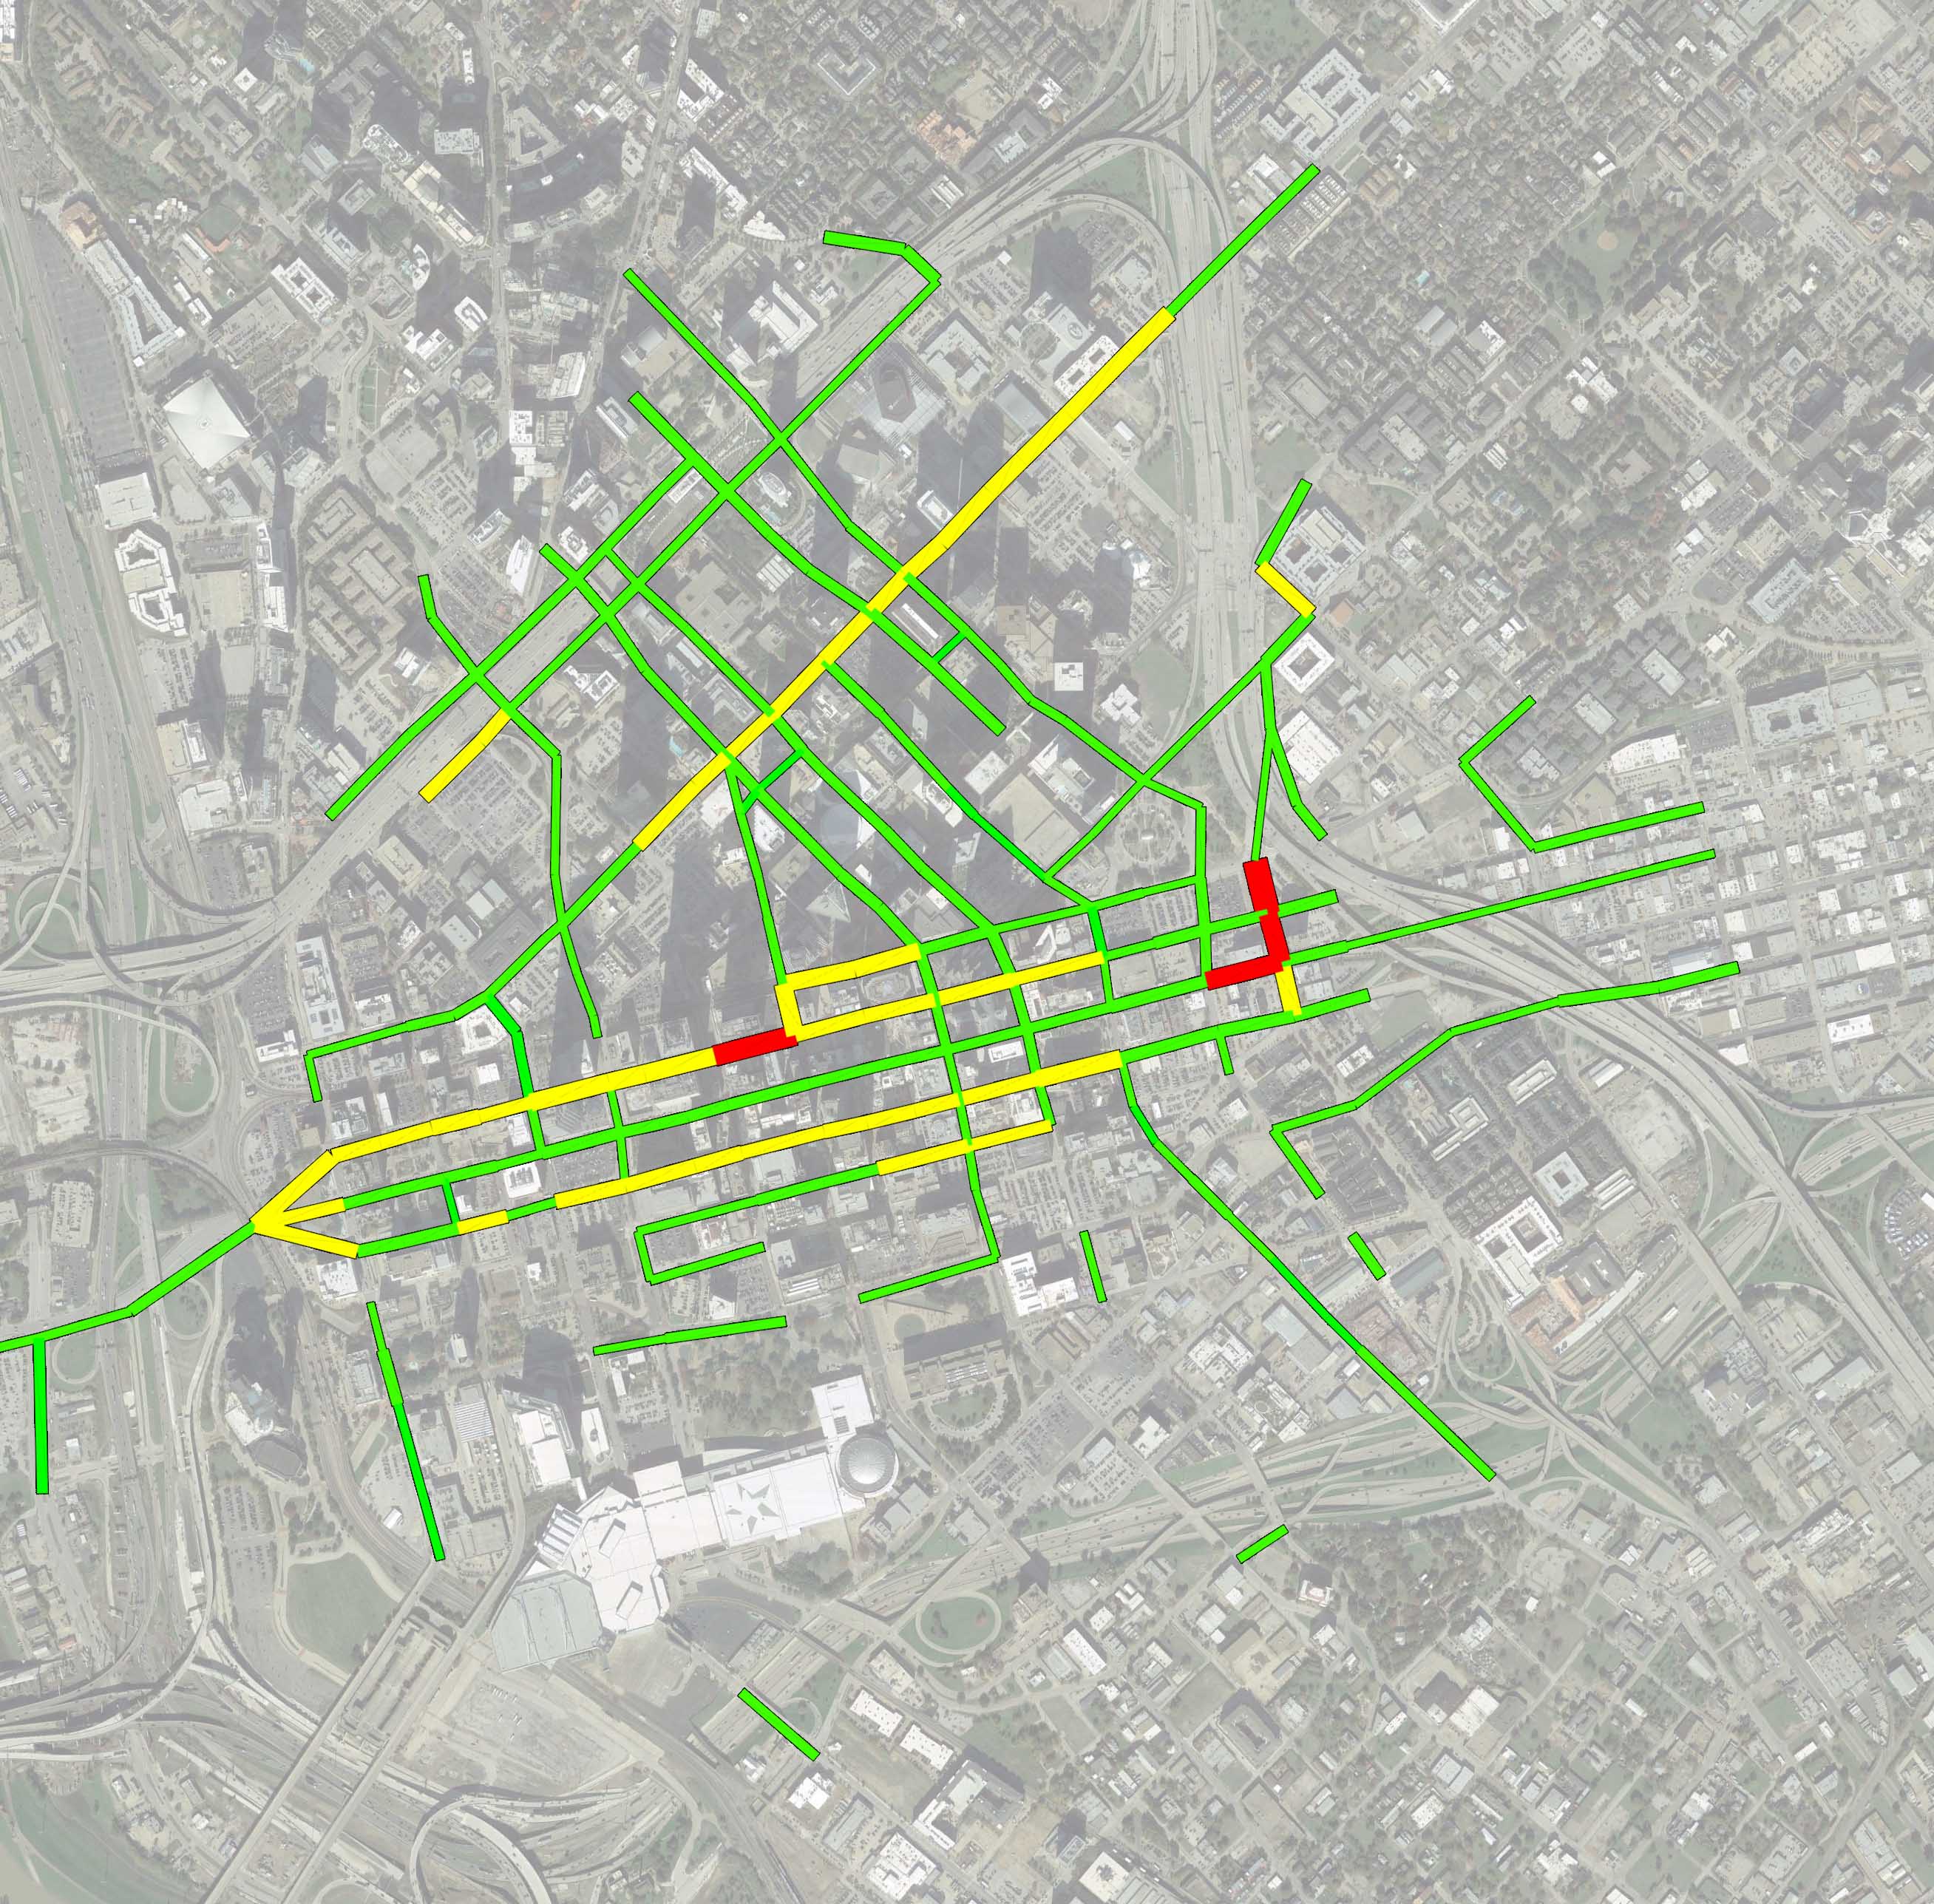
If we strip out the blue, we get something that looks like this. We might call this the ‘useful network.’ You begin to see the city’s underlying geometry and relative interconnectedness (or disconnectedness) emerge. You can also see where choke points occur, at the red segments, where one-way Akard meets one-way Elm in a race to get to I-35. This also occurs where Main, Commerce, and Cesar Chavez are all trying to get onto 75 North. Escape Routes and Choke Points. This is traffic that devalues.
On the other hand, you can see proportionally higher degree of connectivity between downtownn and uptown, as compared to downtown’s connections in all other directions. There is also more real estate & economic activity. These two things, physical and economic integration and activity, are fundamentally inter-dependent. To revitalize the other areas, 1) we have to improve parallel or ‘redundant’ connectivity and 2) not fear traffic but tame it.