Speaking this week on the contentious debate over what to do with Dallas’ Confederate monuments, Mayor Mike Rawlings talked about the “racial injustices of the past,” as well as the institutional racism that persists to this day.
A new interactive online tool released by the National Community Reinvestment Coalition charts out the effects of some of those injustices, combining notorious “redlining” maps of the 1930s with current data on neighborhood income and demographics. Redlining is a term for the denial of loans, mortgages, and other services based on a neighborhood’s demographic makeup — in the U.S., black communities have usually been the ones targeted. The practice gets its name from the red outlines drawn around “high-risk” neighborhoods in maps created in the 1930s by the Home Owners’ Loan Corporation, a New Deal agency formed to refinance mortgages during the Great Depression.
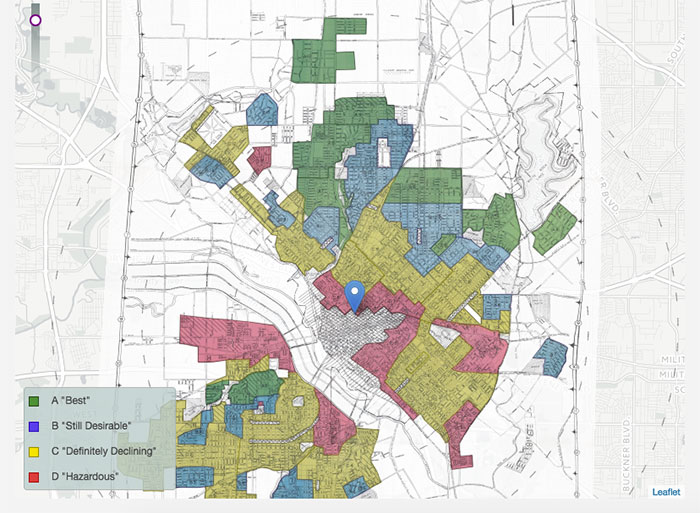
Those HOLC maps have become infamous as stark visual representations of the government abandoning black communities, as a federal agency labeled nearly any community with a significant minority population “hazardous” for lenders. Researchers at the University of Richmond digitized the maps last year, and its site lets you see HOLC’s assessments of each neighborhood, many of them remarkably frank about their racist discrimination. A 1937 HOLC map of Dallas is below. Neighborhoods marked green were considered “best” for government-backed mortgages, blue “still desirable,” yellow “definitely declining,” and red “hazardous.”
The federal government set the standard for redlining, and, as has been described in detail elsewhere, the practice spread throughout the mortgage industry and beyond, preventing investment in black neighborhoods and reinforcing a segregated, unequal society. Redlining was made illegal by the 1968 Fair Housing Act, but its effects linger.
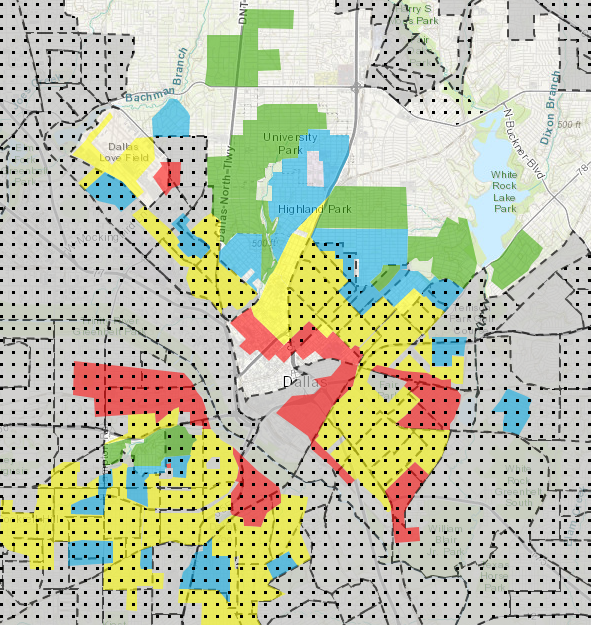
Which is where these new maps from the National Community Reinvestment Coalition come in. Using the HOLC maps of the 1930s as a base, the organization added current economic and demographic data. Here’s a version of that 1937 map with a couple new layers. Gray areas, outlined in dashes, are where the majority of residents were minorities as of the 2010 U.S. Census. The dots mark places where the 2015 median family income was below 80 percent of the area median income.
As Dallas weighs what to do with its Confederate monuments and wrestles with a sometimes ugly past, it seems the history of redlining in the city should also be considered.