Regardless of where you stand on reading the second amendment, gun violence statistics speak for themselves. Guns are involved in around 33,000 deaths a year in the United States. In 2013, according for the Centers for Disease Control and Prevention, guns were responsible for more deaths than falls, alcohol, or fires. Researchers forecast that in 2015 more people will be killed by bullets than car accidents in America. Every year more than 130,000 people are shot. And only two percent of those deaths are the result of mass shootings. Most of the gun violence is happening all around us, every day.
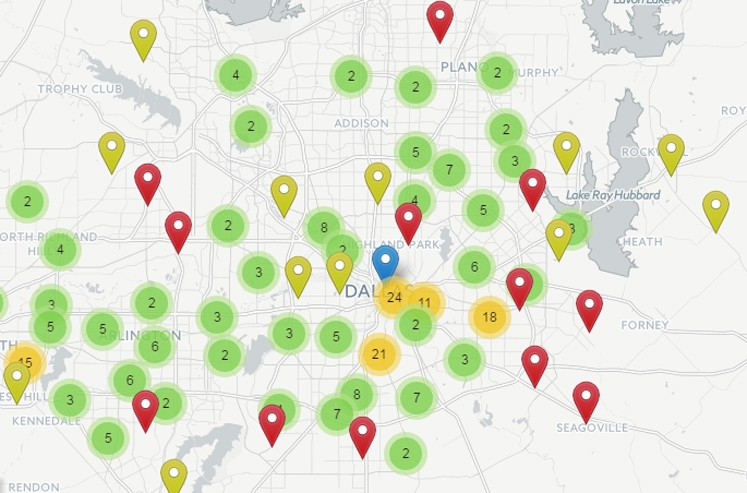
In an effort to drive that point home, a nonprofit, nonpartisan project called the Gun Violence Archive has collected data from all the shootings over the past year and plugged them into an interactive map. When I entered Dallas into the map, I expected it to look like so many other demographic maps of this city, from that income inequality map to the location of jobs, with a large concentration of gun violence in the south and less in the north. And while it does look like there are more shootings in southern Dallas, what’s more striking to me about the Gun Violence Archive map is that the shootings over the past year in Dallas have taken place everywhere in the city. You can poke around the map here.