Before we head into the weekend, I thought I’d jump back into the fray after some time away from the office with a really depressing post about poverty growth in Dallas. Shall we?
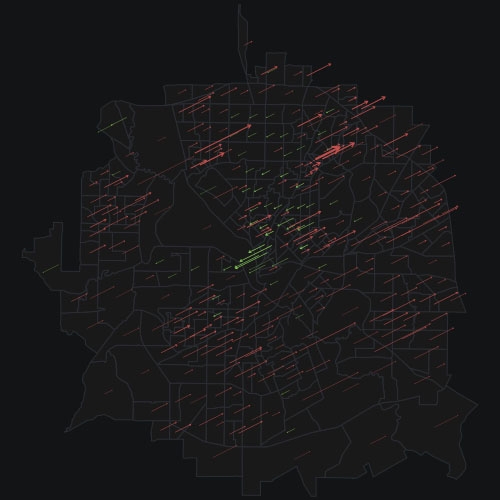
I don’t have new information for you, just a new way of looking at it. The data comes from a report from 2014 put out by cityobservatory.org which looked at population change in the nation’s poorest urban neighborhoods and argued that the most pressing problem confronting our cities is not gentrification, but rather the concentration of poverty. This concentration of poverty is illustrated in a map I pointed to back in July that showed income inequality broken down by neighborhood. But now we have a new set of nifty maps by designer Justin Palmer that presents the issue in bleak, ominous tones. (h/t Citylab)
See that dark, brooding image above? That is an attempt to illustrate the increases and decreases in poverty in different neighborhoods in Dallas. The red arrows represent where poverty has increased. They are thicker where populations are denser and longer where poverty has increased more. The green arrows represent where poverty has decreased. You can see them clustered around Uptown and fanning out through the central part of North Dallas. The biggest decrease looks to be in West Dallas.
Notice how this map doesn’t strictly follow the north/south divide that we so often fall back on to explain our economic divisions. Vickery Meadow’s transition from singles enclave to immigrant slum offers the most dramatic section of the map. Also notice how poverty is increasing basically everywhere in Dallas. In fact, 19.7 percent of census tracks in Dallas are newly poor. “Newly” is defined here as census tracks that had a poverty rate of 30% or more in 2010 that did not have that rate in 1970.
I bring all this up not to ruin your weekend or put a damper on the excitement over our new Dallas City Council. It’s just that it made me think of that other map with the arrows pointing at all different parts of Dallas-Fort Worth, and I thought it offered a powerful reminder of where our political focus needs to be.