Given today’s lengthy presentation and subsequent discussion between DART president Gary Thomas and Dallas city council, I put together a few quick maps to help discuss the challenges and potential opportunities of transit. This should be a long treatise, but I only have a few minutes to slap this together, pull the data, scale the maps, etc. Consider it the start of a conversation.
The first map is Job Densities in Dallas, with a particular focus on Dallas county (because it’s easiest to scale maps to nice square boundaries, that’s why. Job density is one of the key driving factors in increasing ridership. Others include housing density near transit facilities, frequency and reliability, and the accessibility (walkability) of the areas surrounding transit. There are others, but these seem to be the ones that most significantly move the needle.
Job densities are important as they are a major destination for transit trips. There are others, but these are the easiest to measure and compare. Other areas, types of destinations have to be served as well, but if most car trips are during rush hour and the streets are most congested at rush hour, it is the home to work trip that can be the most beneficial to reducing congestion. Therefore, this post will focus on comparing other factors to job densities.
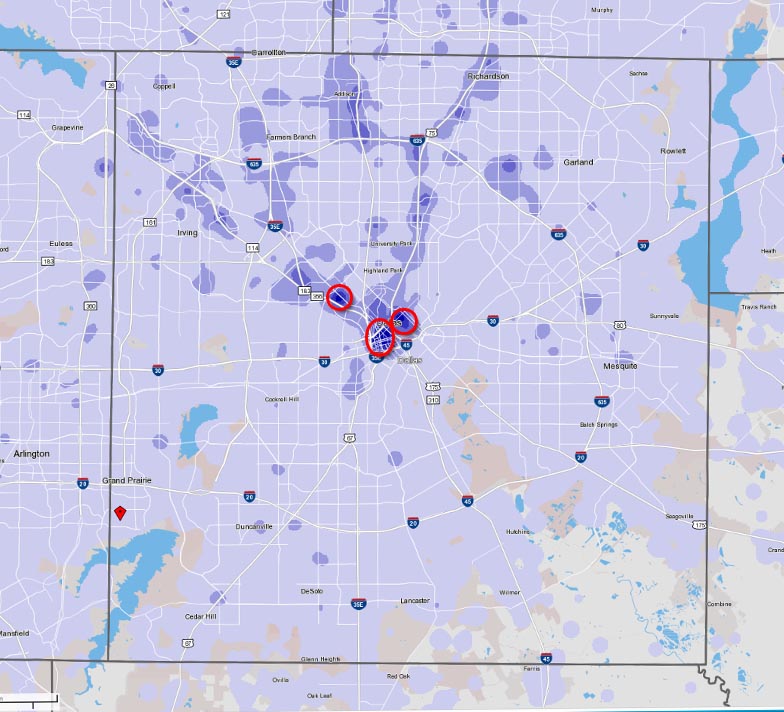
I have highlighted the areas with the greatest job densities in the region (darkest blue). The density threshold for the most dense clusters of jobs in Dallas are about 41,000 to 64,000 jobs per square mile. That’s just a number. Let’s compare that to other places and what kind of densities create more ridership. Ridership, of course, is important as a measure of both utility of transit and revenue via ridership. Put those two together and you get something close to the efficiency of a system.
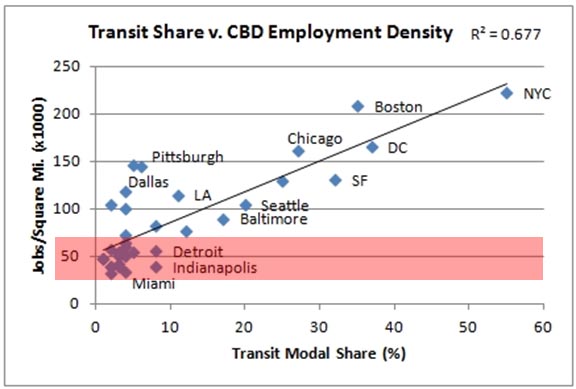
There is a decent amount of noise to that graphic. It’s an older one from Robert Cervero. Let’s see what my research this year looks like from 2014 data:
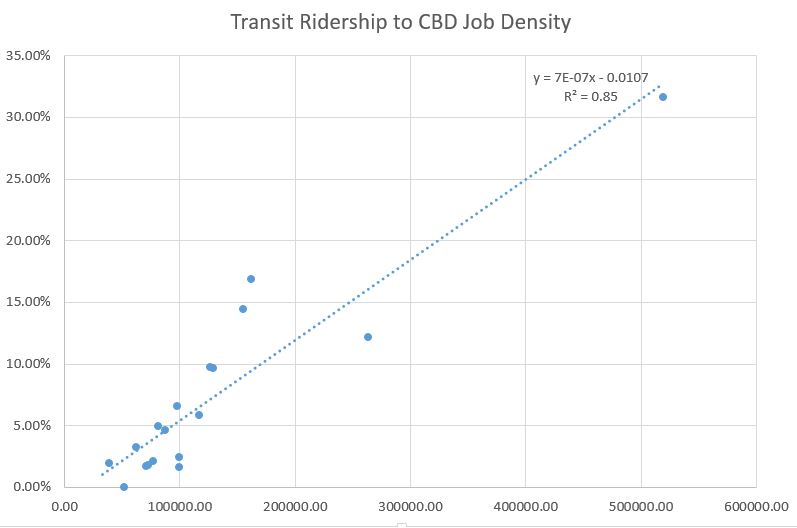
Nice. That’s less noise in the system. As you can see from all three charts is that we really don’t have the job densities anywhere to really drive transit ridership (I have other charts that show the relationship between parking costs and transit ridership, but we’ll save those for another time). Point being we need more job clusters, particularly in the CBD for transit to be seen as viable, which of course requires transit that is useful, reliable, frequent, and not absurdly time consuming or requiring too many transfers.
On to residential density:
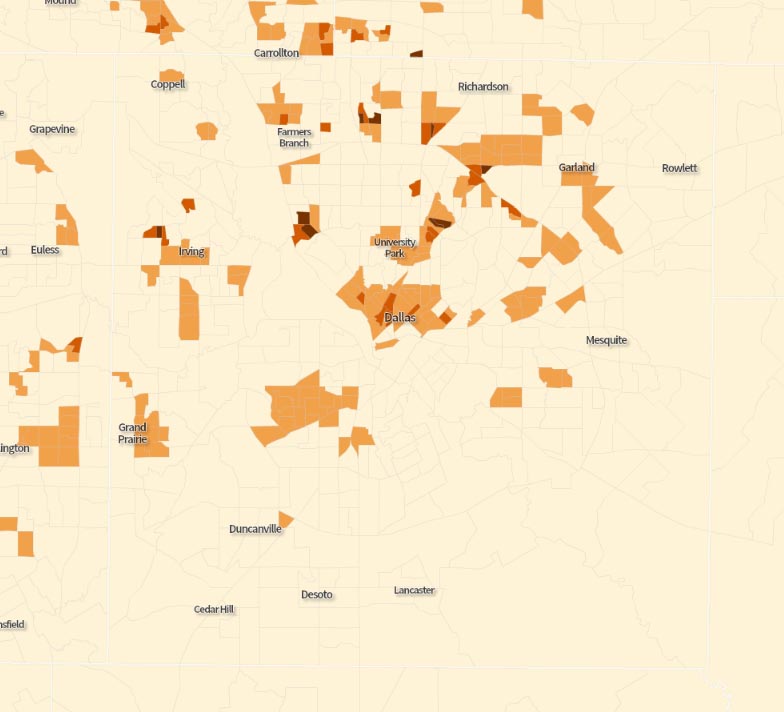
Yikes. Here is the (one of the) other problem(s). The are three residential population thresholds included above. Greater than 10 per acre is orange. Greater than 20 per acre is darker orange and greater than 40 per acre is brown. These are some of the, albeit rough, thresholds where you start to see significant spikes in transit ridership.
Where do current transit riders live (not to say that will always be the case, but these are existing customers)?
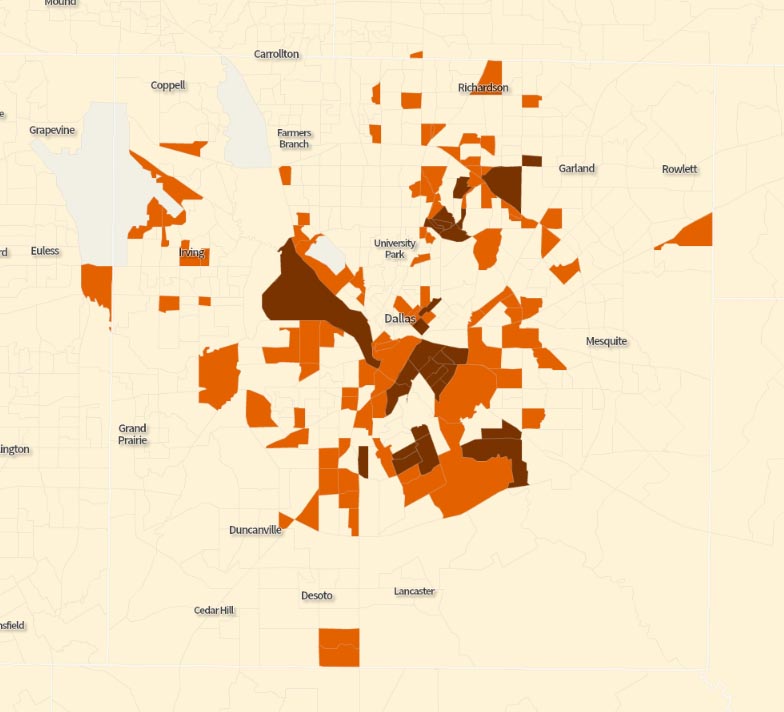
Orange is greater than 5% commute to work via transit. Brown is greater than 10%. These aren’t high numbers, but I’ve got to show something. Don’t I?
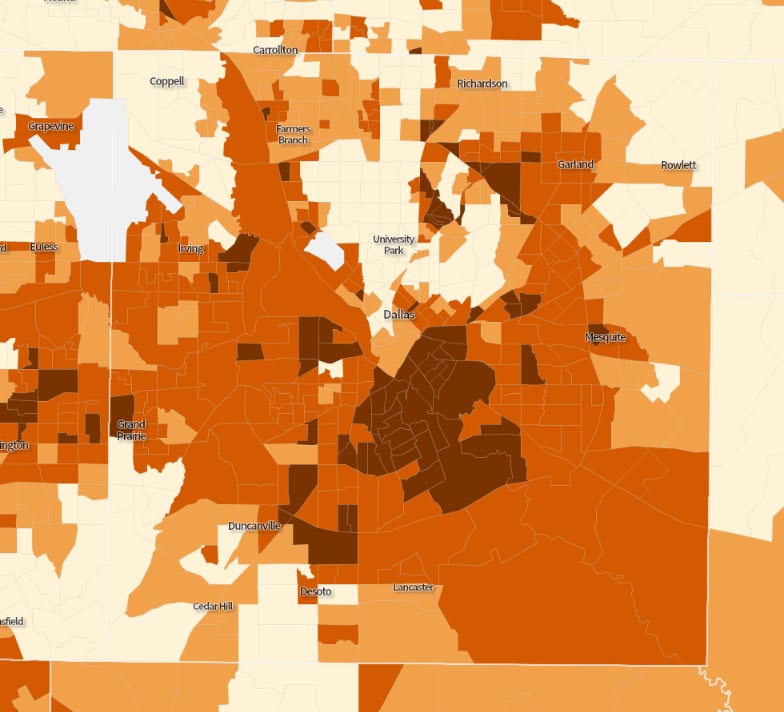
Lastly, is income, which I show at three thresholds: Brown is census tracts with median household incomes below $30k, Orange 30k to 50k, Light Orange is 50k to 75k. I chose these numbers as roughly equivalent to transit dependent, transit optimal, and transit if its suitable. Of course, the best systems are where transit and land use are such that all socio-economic demographics ride transit because the service is so frequent, reliable, and convenient.
Unfortunately, the strongest correlation in Dallas with transit ridership is not density, but income (lack thereof). We also know that good transit access to jobs is an essential element in the fight against poverty. In other words, we have a lot to overcome and it’s going to take a lot of hard work to build a just, convenient, multi-modal city.