For today’s lunch hour, I’m foregoing eating because I feel like expanding on the Boston commuting pattern study to take a similar lens to the Bay area.
As with the Boston study, the first map below shows the primary mode of commuting. In it, I include driving alone (orange), transit (includes ferries – green), walking (blue), and bicycling (red). You can’t see any bicycling in this map, but I’ll get back to that. Whatever color shows up means that particular census block group commutes to work by its color coded mode more than any other mode of travel.
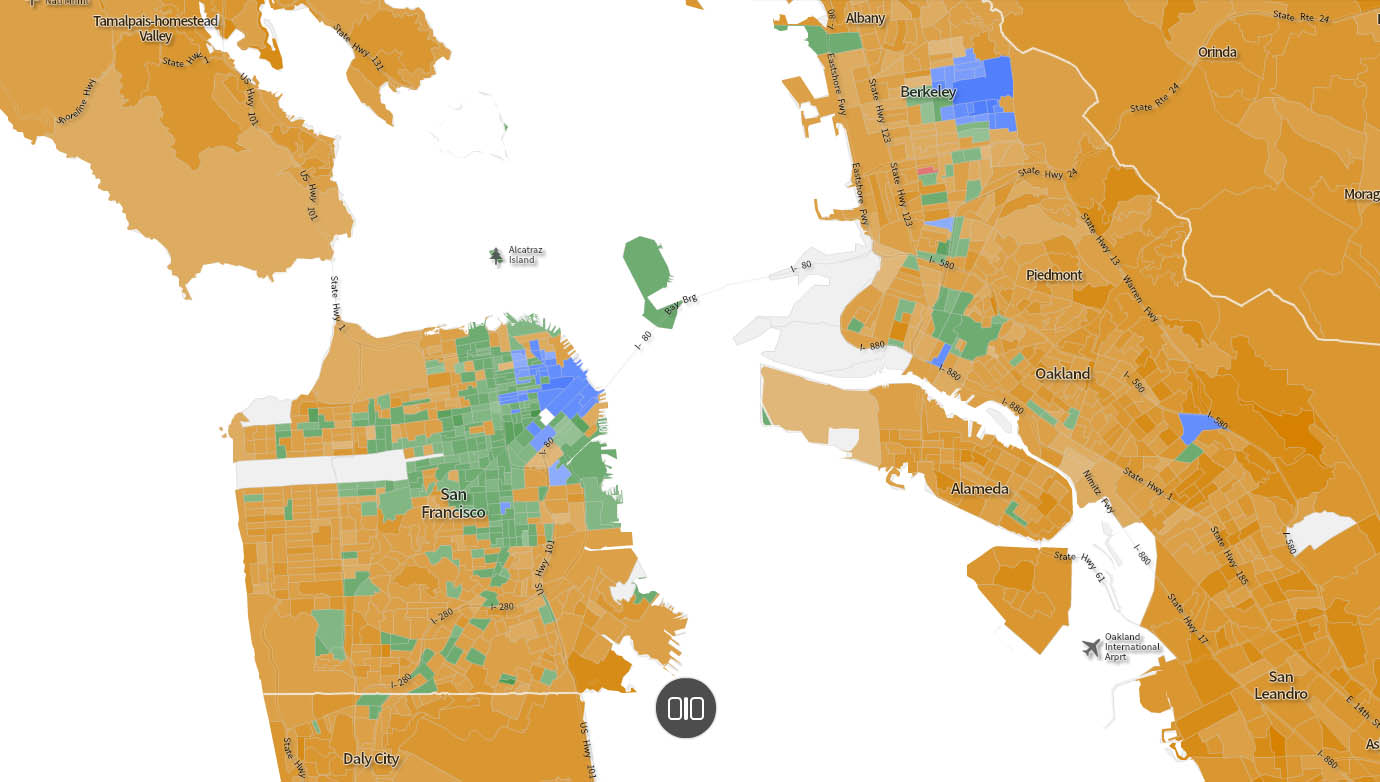
What shows up above is two highly walkable cores. These two are San Francisco’s CBD and Berkeley. What is interesting is that downtown Oakland doesn’t show up as a walkable cluster, outside of but one blue tract.
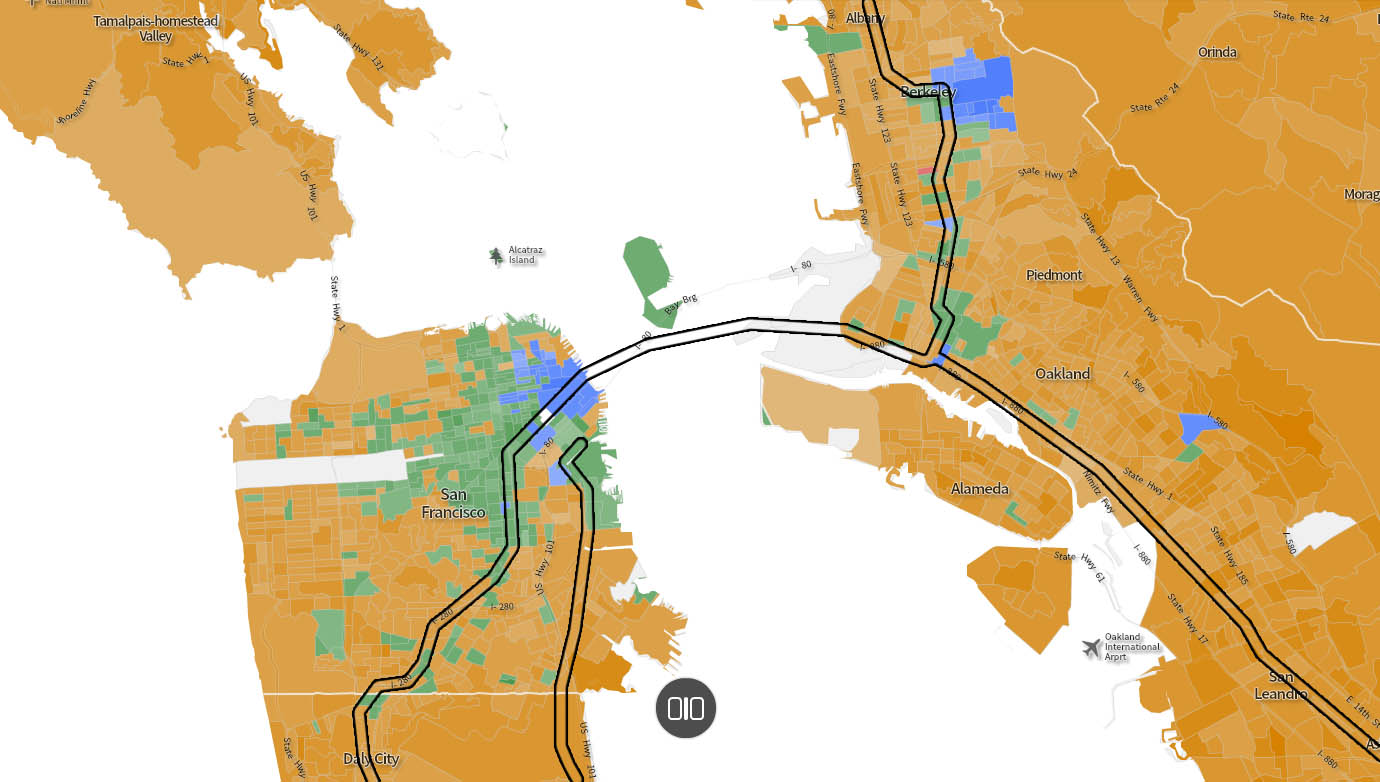
Above shows the transit lines, and of course the first thought is how little rail transit the Bay Area has. The green areas track with the rail alignments but also envelope the CBD. If you’ve ever been you know that busing is common way around for residents. The buses are both frequent and crowded, running up and down the orthogonal grid. What isn’t showing up above are the light rail trams, which unfortunately don’t register on google earth as subway lines.
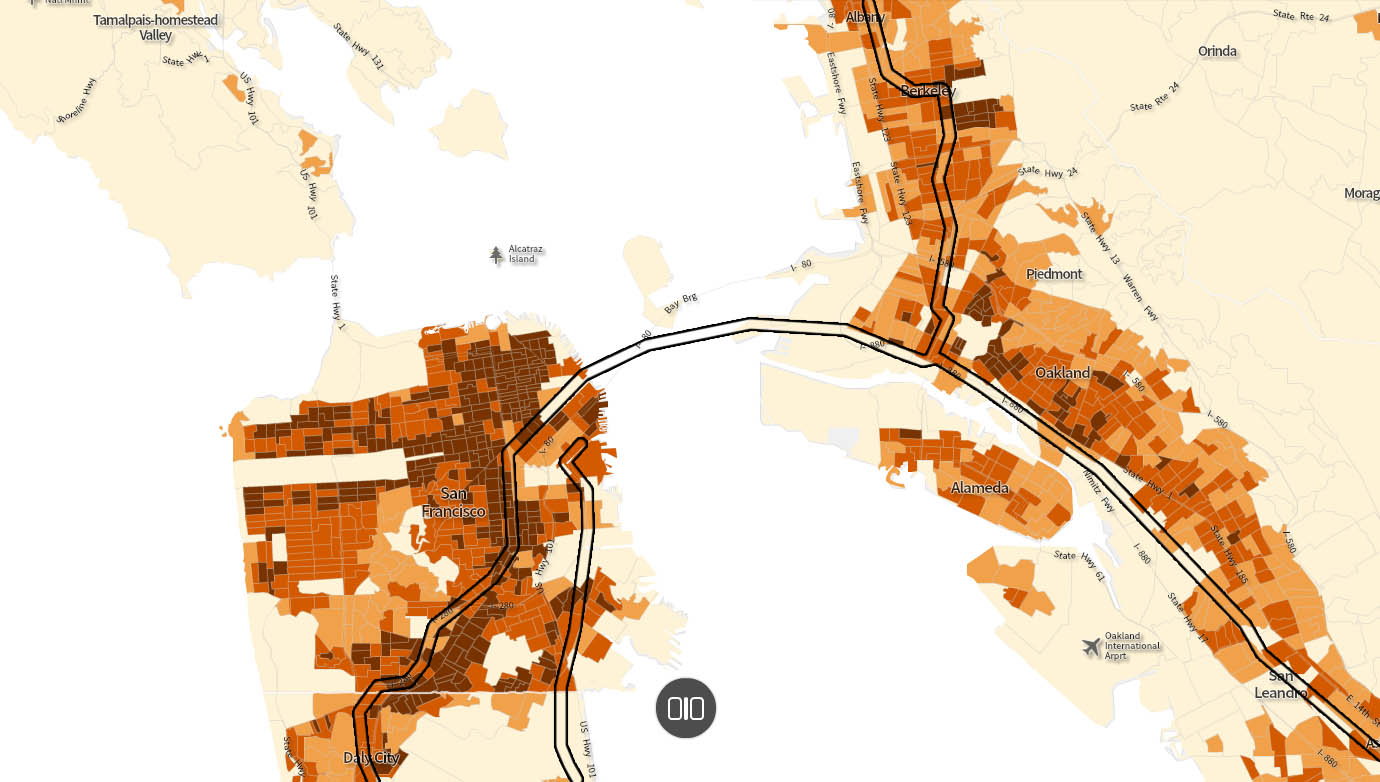
Above is a map showing population density gradient using same thresholds as the Boston study: minimum for transit, good for transit, and ‘peak density’ – again where the benefits of density begin to taper off. Like with Boston we see that the walkable cores show density donut holes with high population (brown) immediately enveloping them the destination clusters (job cores).
Because downtown Oakland didn’t show as a walkable cluster, suggesting based on previous studies it is missing either 1) enough destinations (jobs) or 2) requisite immediately surrounding density or 3) adjacent connectivity or 4) all or any combo of the above, I chose to dig a bit further into each core.
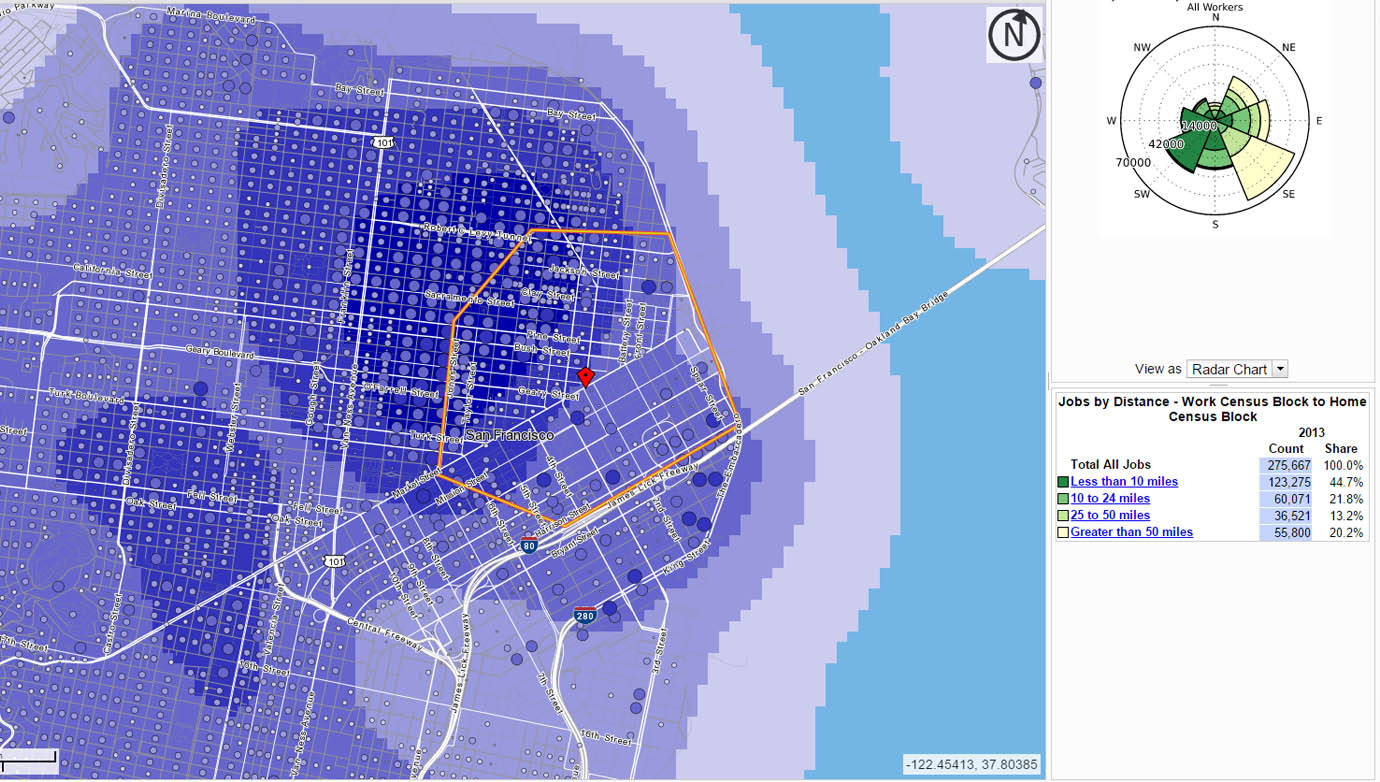
To make each of these maps, I used Onthemap from the census, drew a big circle to highlight residential, which then gave me heat maps of job clusters (above is not that map). Where job clusters were the highest (aka CBD), I then drew a smaller study boundary around these high intensity job clusters. They tend to be about a mile square in area. This is the above map. The associated color coded heat map is now showing residential density, ie where I’m highlighting destinations the map gives me back the origins.
I also selected several years to see how jobs and populations changed. The San Fran CBD circle was 1.3 square miles and has an astounding 275,000 jobs. This number grew from 207k in 2002 to 223k in 2008 and then all the way up to 275k by 2013 (latest available data). What’s interesting is that with this job growth, the distance the average worker is travelling is increasing, as the percentage of workers commuting less than 10 miles has dropped from 51% to 44%, meaning more people have to get in and out of the CBD by means other than walking. This suggests to me the need for more routes in (ideally subway) as well as upzoning to allow for more density (and that’s before even getting into their haywire housing cost issues).
We might speculate that the need for upzoning is supported by the steady worker population within this study boundary, going from 17.5k to 19k to 18.5k over the same selected years (2002, 2008, 2013). Interestingly, of those 18,500 resident workers, the percentage that live AND work within this boundary has gone UP to 80% from 70% from 2008 to 2013.
The other interesting point for contrast when we get to Oakland is the darkest blue above is immediately adjacent to the CBD (and even overlapping – Chinatown area) with no physical or infrastructural barriers between the two, hence the high degree of walking to work in the first map. Now, why doesn’t Oakland walk?
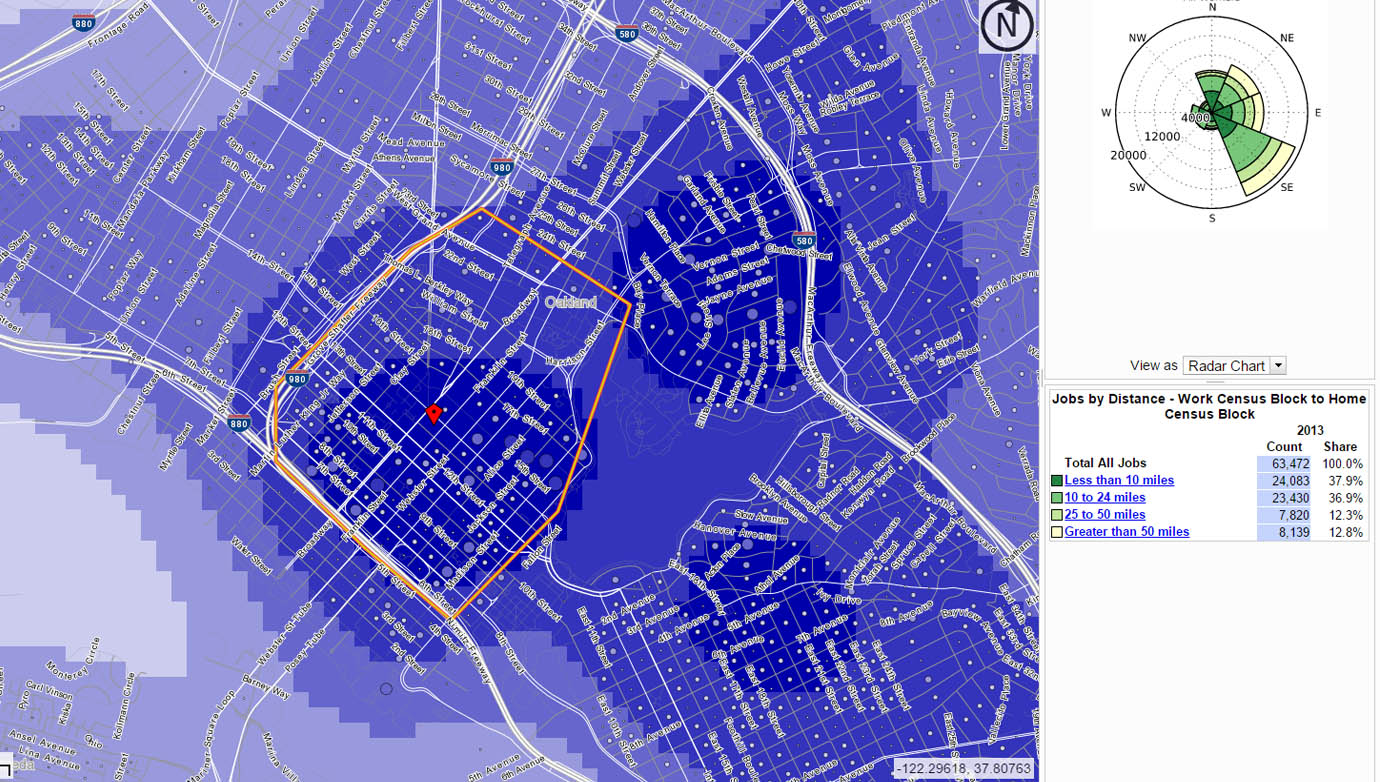
Downtown Oakland study area is roughly defined by the highways and nearby lake. However, these physical boundaries have direct implications, since I didn’t use any of those features to draw the boundary, but instead used just the job heat map. Cross those boundaries and job densities plummet (until you get to the port). The dark blue areas above show the three residential clusters, one east of the lake, one north of the lake, and one smack in the middle of downtown Oakland.
The study area is slightly smaller, only 0.94 square miles, but also has significantly less (but a growing job core). Downtown Oakland had 63,000 jobs by 2013, up from the mid 50’s in 2002 and 2008 (a period where job growth was pretty flat – perhaps recent price trends in SF is shipping jobs and people to cheaper and more malleable pastures in downtown Oakland?). And similar to the jobs in downtown SF, people are commuting further to get to these increasing jobs. The percentage that commute less than 10 miles has dropped from 45% to 37% over the study span.
But why isn’t there much walking for the 13,000 or so residents and 8,000 workers that reside within the study boundary? Well, for one it seems the majority of workers are going to San Francisco based on the radar (not shown here). But if you look at the above radar, you see very few workers live to the west of Oakland. Very few are commuting from SF to jobs in Oakland, but most of downtown Oakland residents are commuting the opposite direction (or they’re also working in downtown Oakland). In other words, downtown Oakland is somewhat of a bedroom community for San Francisco. Though, I suspect that will increasingly change as Oakland becomes increasingly desirable.
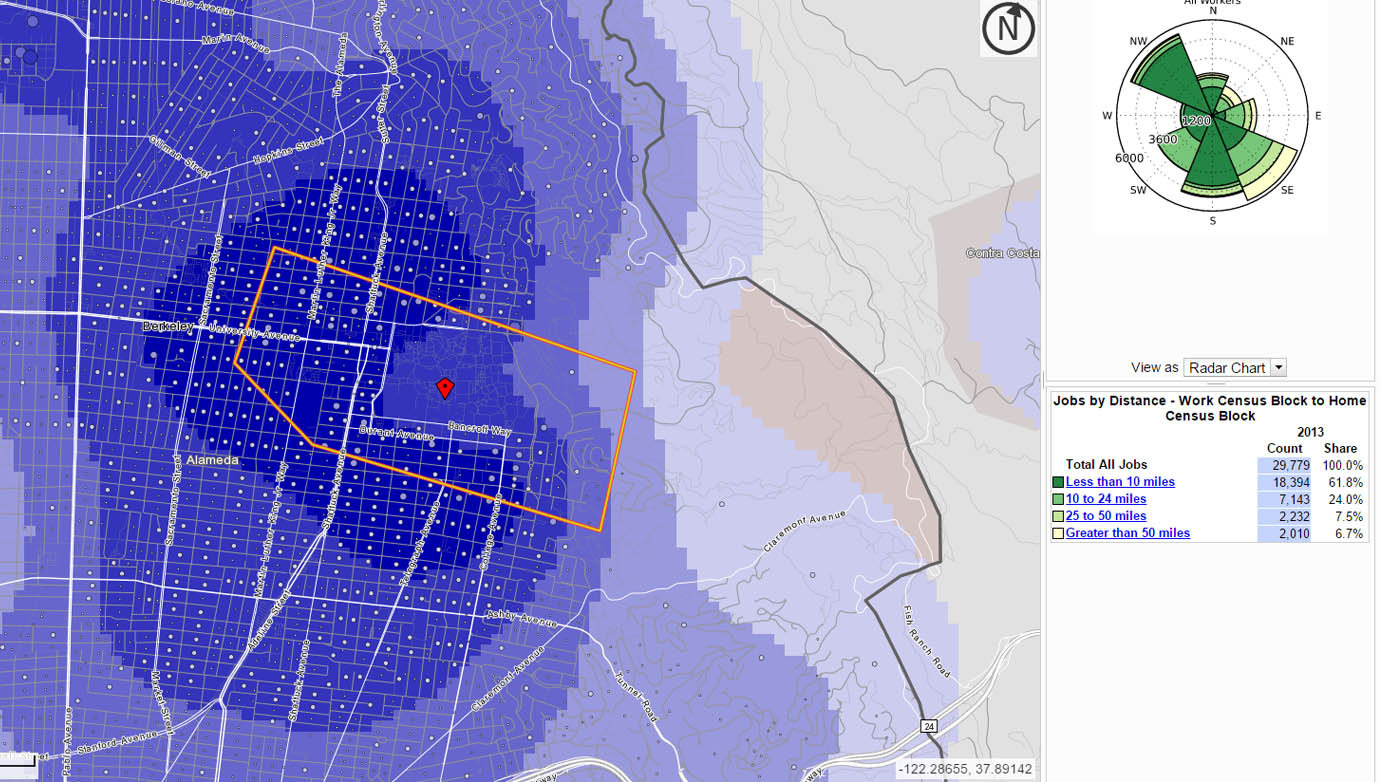
I included Berkeley, because as we learned in Boston, the universities are very walkable. But also to contrast with Oakland. The darkest blue residential density areas hug the job cores – in this case downtown Berkeley and the university, which is up against the mountain – thus, the asymmetrical nature of the map (everything to the west).
On the other hand, Oakland had physical boundaries separating population and potential for increased density from the job core. Both the lake and the two highways create these nearly impassable barriers. This suggests that Oakland probably ought to remove highway 980, as is being proposed.
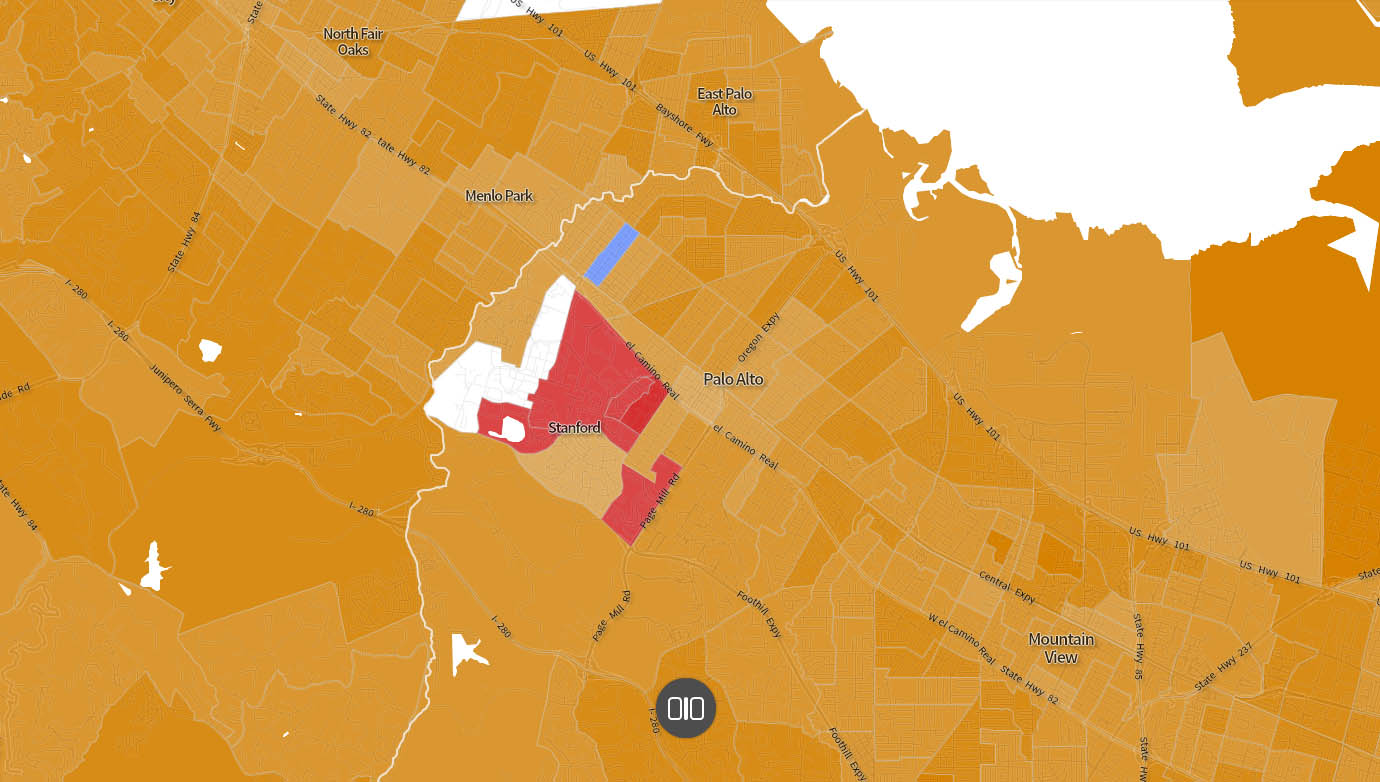
If you look closely you can tell what’s happening above. In the Boston study I wondered where else in the country might have census tracts that bike to work more than any other mode. This trait is in fact so rare that there is not a single case in any of these cities: NYC, Chicago, DC, Baltimore, Minn/StP, Seattle, LA, or San Diego. If you recall there was one tract in Boston. I found three tracts in Philly where biking to work was the primary commuting pattern and two in Portland. However, above I found a new champ. Palo Alto, or more precisely, surrounding Stanford, which is interesting because every other university I’ve looked at walking was the winner. Not at Stanford, where the bike is king.
[looks at time] Nice! I finished this in less than 40 minutes and have time for a bite.