Over and over again I’ve heard the most important issue we have to address is how to get all of the workers from Pleasant Grove area to the jobs in the Stemmons Corridor area. So I decided to look into the data myself. It turns out, that argument doesn’t hold water. That is, unless you fudge the data. By the end of this post, I’ll show you how that gets done.
Before we get into that, we have to acknowledge that congestion isn’t getting worse. It’s getting better.
Not only does the Texas Transportation Institute’s Mobility Report state that driving (average vehicle miles traveled) per capita peaked in 2006 in the DFW area. With that, the costs of congestion have also peaked and have been falling ever since.
When we look at the specific data along Stemmons Corridor (the stretch of road needing to be ‘relieved’), we see that traffic counts are actually dropping year over year.
| 2012 Traffic Count: | 269,221 (Current Year Estimate) |
| 2004 Traffic Count: | 273,000 (Average Annual Daily Traffic) |
| 1997 Traffic Count: | 281,840 (Average Daily Traffic) |
Looking at another section of the highway, we see the same pattern. Using TxDOT’s data, we see that in 2007 (closer to when driving peaked locally), Stemmons moved 276,000 cars. In 2010 that number dropped to 263,000. By 2012, it dropped to 234,000.
It’s also scheduled for ‘improvement,’ whatever the hell that means. My version of improving it would be dropping it and creating more bridges across it like the 405 as it goes past downtown Portland. The entire grid is stitched. If we were to do the same thing along Stemmons, we could better link the jobs in the Medical District with the potential for housing and mixed-use walkable neighborhoods in the Design District and the Trinity Strand Trail. More on that in a future post since I’ve already begun that study.
Now, if we’ve acknowledged that more highway capacity isn’t really necessary, let’s look at why we’re apparently building it. Using census data, I drew a study area boundary around what I’m referring to the southeast sector. This covers everything from the Trinity to the White Rock outfall, to I-30 in the north to Balch Springs in the east. As you can see below there are 35,073 commuters living within this boundary going to a job somewhere. It’s worth noting this number dropped from over 40,000 while those commuting more than 25 miles increased from 15% to over 21%. As jobs get further away, residents are either following (leaving the area) or are driving further.
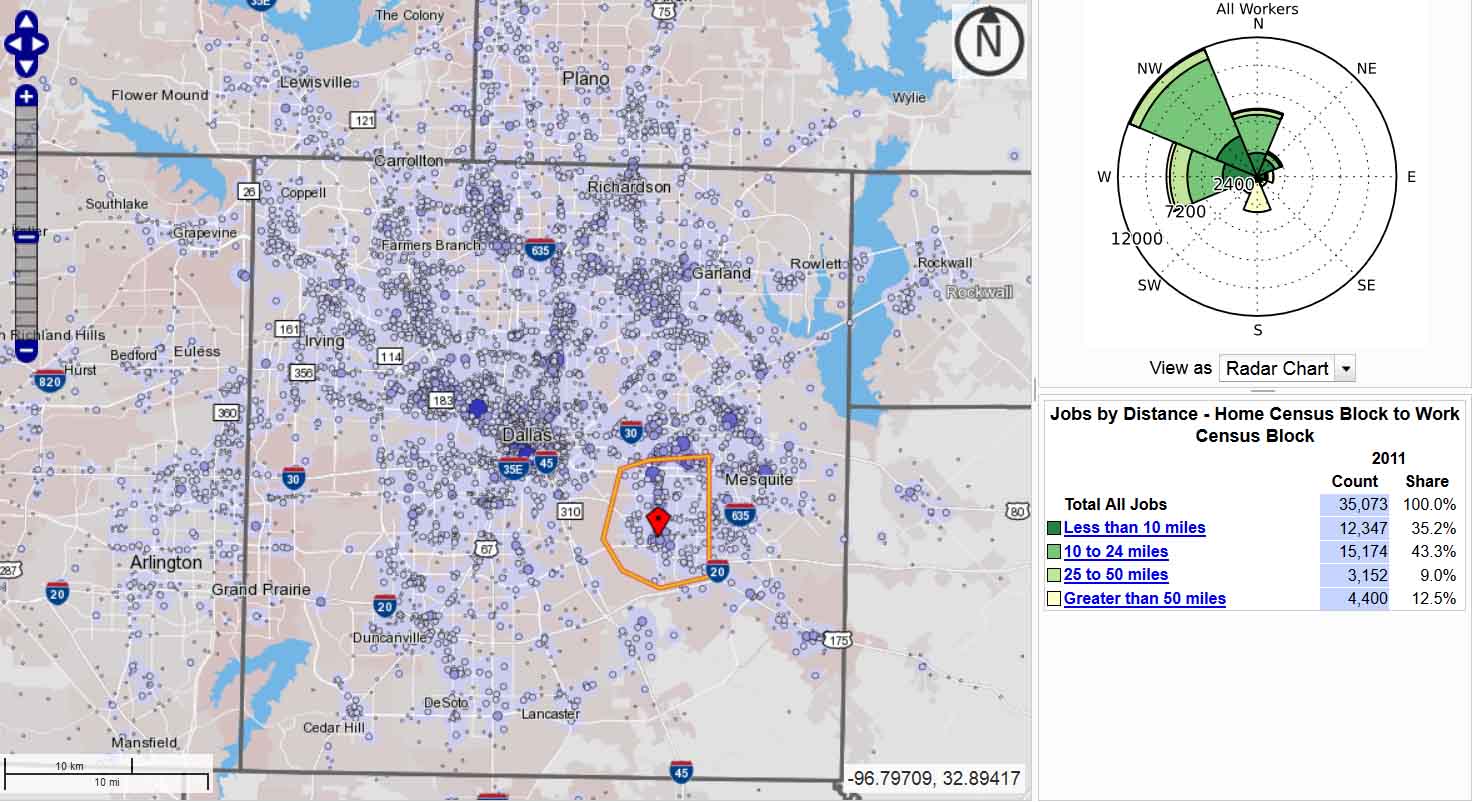
As you can see by the heat map above, yes much of the southeastern sector is travelling northwesterly to jobs. But not all and certainly not enough to say that they’re all working along Stemmons Corridor. So I changed the parameters to look at which zip codes they are commuting to and then I added them up by area.
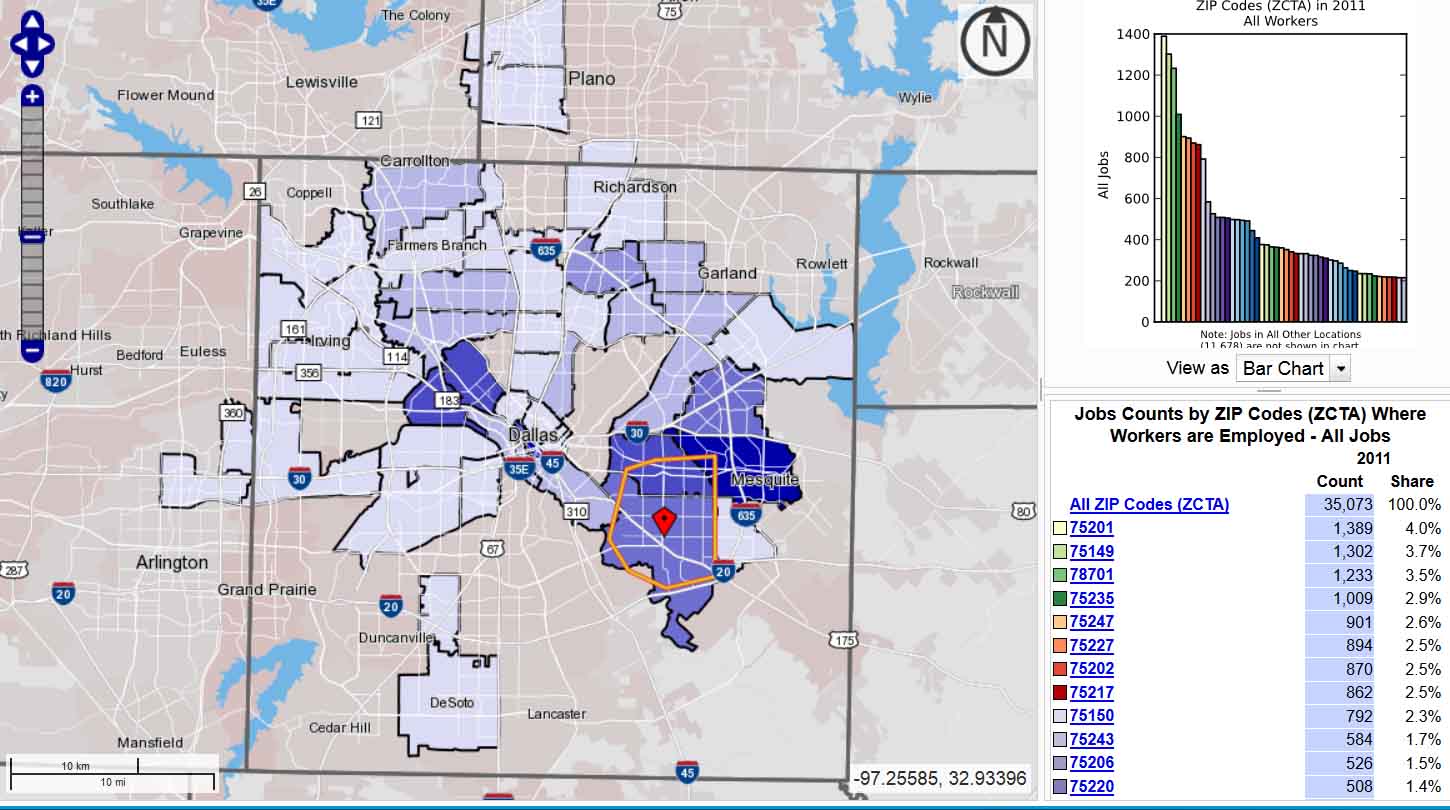
While Stemmons is one of the primary destinations for these commutes, it doesn’t show up as the number one census tract. That is downtown, with 4% going to downtown. The four primary areas for these commutes are downtown/uptown, Stemmons, the Southeast sector (people living and working in same area), and up 635 in the northeast sector near Garland. So I added up all of the commutes of these census tracts in each area and found the following:
Downtown/Uptown/South Dallas:
While downtown and uptown are both in the top 5 for individual census tracts, these three add up to 2756 or 8% of commutes are headed to the core.
Pleasant Grove:
The five major census tracts here add up to 4191 commutes or 12% of all commutes.
635/Garland/Northeast Sector:
There were nine census tracts here totaling 3732 commutes or 10.5% of all trips
Stemmons Corridor:
I looked at every single census tract along Stemmons/I-35 between uptown all the way to Coppell and DFW airport, a total of ten tracts. Of the 35,000 commutes from Pleasant Grove area only 4,625 area using Stemmons to get to jobs.
————————–
Does it make sense to spend $1.7 billion for 4,625 people? That’s nearly $400,000 per person. Just write them a check directly if we’re so intent on spending it.
The next question is, how do we get to these traffic projections predicting doom and gloom when the FHWA just released a new report effectively admitting their traffic projections have been wrong 61 times in a row and are now predicting that driving will remain flat until 2040 while actual data shows the traffic counts dropping on Stemmons?
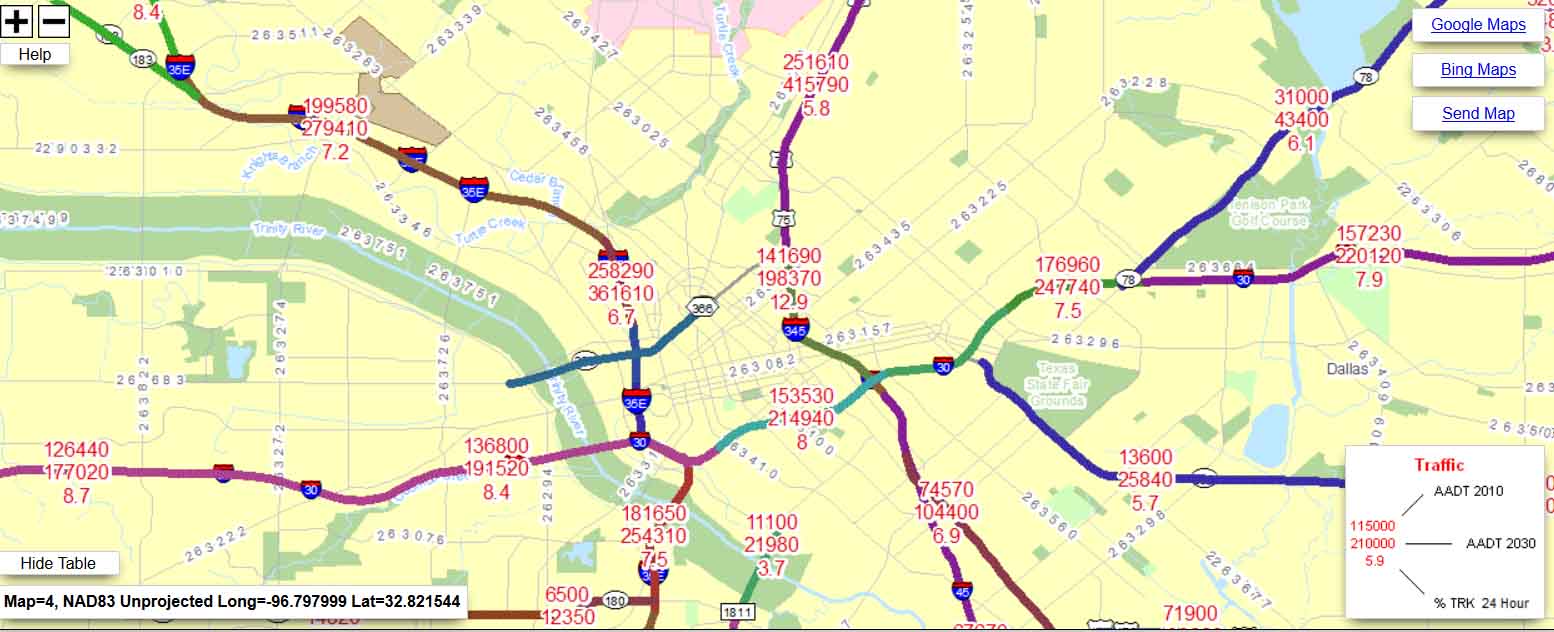
Above are the official traffic projections. The first number listed is current traffic counts. The second number which is crazily high is future traffic projections (despite, of course, that we’ve established traffic and driving is falling). The third number is percentage of trucks.
The numbers I want to pay attention to are for this exercise are Stemmons. 258k vehicles per day going past American Airlines Center. We’ve established above and using this very same TxDOT website these counts are dropping. Yet, their arbitrary formulas believe we need to build for 361k vehicles per day.
How does this happen and how do we get to this point where future traffic projections are so skewed from reality and yet are used to define policy and infrastructure design and expenditures? I’ll tell you. First of all, they set these out 20 years in advance. Who knows what life will be like in 2035? Only traffic engineers apparently.
In other words, they’re not trying to solve problems of today. They’re trying to fix hypothetical future problems that exist only in their own mind. Or in their warped traffic models.
What they do is take the population growth trend line and extend that indefinitely. No matter that we’re facing severe water issues, are chewing up agriculture land in the name of more highway building and sprawl, or public debts that nobody will want to move into and we choose to ignore. We’re going to hit 11 million people apparently by 2035 and Dallas County will be at 4 million or whatever. Then they put all of these hypothetical new people wherever they need them to justify endless highway expansion. Want to know how the Blacklands Corridor demanded a new highway? They said 40,000 people would be living along it in 2035 even though the small towns out there don’t want that kind of growth.
Want to know why the Trinity River Highway is necessary? The traffic model plugs hundreds of thousands of hypothetical future people into the same development patterns that currently exist. They crank up the population, assume everyone is still in cars, and caters to that inertia as jobs and people get further and further apart.
This is attrocious public policy. That’s the old way of doing things, adding highway capacity over and over again until there is no city left. No city, no congestion. Ask Detroit how that works out. Since we know for a fact that more highway capacity lowers population density. That means more highways = more tax burden. Lower density = lower tax base. High tax burden/low tax base is the road to insolvency and municipal bankruptcy. Forget for a second that every traffic model ever for a toll road in this country has overestimated traffic. Just from a development standpoint, this is a road and a public mindset looking for a bail-out.
The new way, rather than trying to build our way out, is through land use strategy. To bring more housing along the Trinity closer to the jobs and bring more jobs closer to the housing. If you need a highway parallel to a highway, you’re failing at city building. There are no quick and easy solutions, but there is right and wrong.
——————————–
In a future post, I’ll show how we can leverage private investment to solve the congestion problem, add tax base, and fix Stemmons.