A lesson from the Embarcadero.
It’s a great time to be alive and study cities. More and more data is becoming more readily available so that we might be better informed how our cities evolve (for the better or worse) and how infrastructure investments either lead to more or less sustainable behaviors and patterns from citizens as well as the real estate market. The way we design and build our infrastructure is the single biggest determinant in eventual land use forms and development patterns. The primary lesson to be learned is if we build more highway capacity, the real estate market stretches out. Because it stretches out, predominantly along highways, then it becomes not only car dependent (things are far away and thus inefficient) then we have to all compete for the same limited space on said highways compelling us back onto the hamster wheel of building more only to use them more. It’s incredibly inefficient and extremely costly burden on both the public and private sectors.
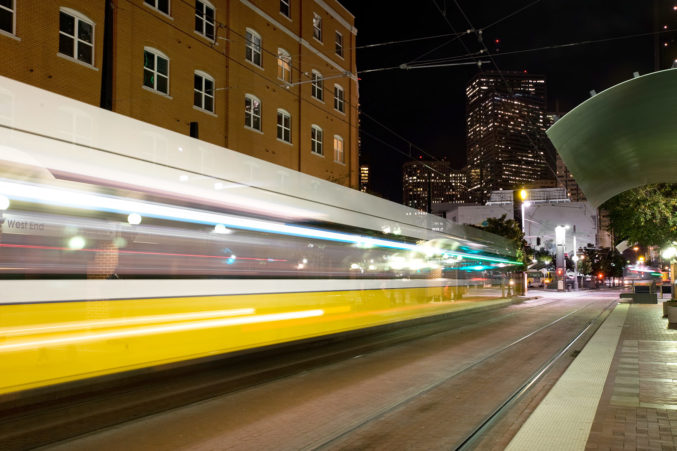
The availability of the kind of data over time means we can see the patterns emerge and the impact certain types of infrastructure have then had on the performance of our cities. To illustrate this, I’m going to show census data around the Embarcadero in San Francisco going back several decades. If you don’t know the Embarcadero it is one of the most famous highway removals in the US. You may have seen a good bit of it on TV recently as it is now the setting for the San Francisco Giants baseball stadium and the World Series.
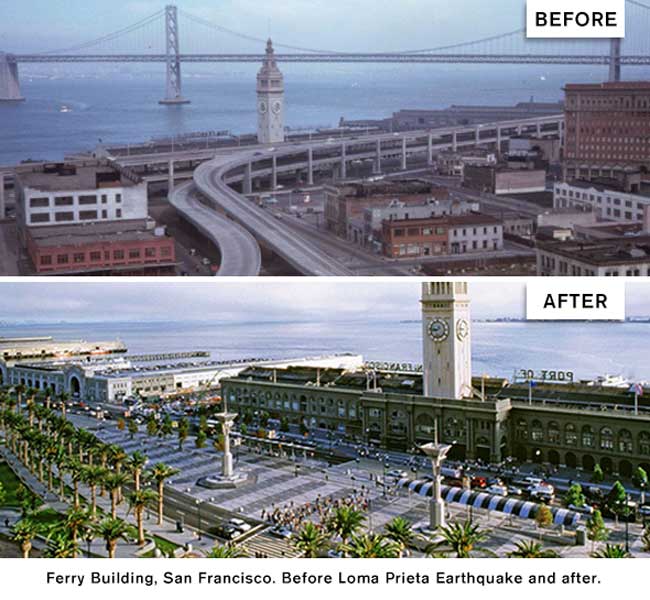
The elevated freeway was badly damaged in the 1989 Loma Prieto earthquake and as fate would have it also during the World Series. After many contentious years arguing whether to rebuild the elevated freeway (because oh noez! Congestion!) or whether to remove it entirely, mending decades of physical and political wounds dating back to the original freeway revolts in the 1960s.

The database I’ve assembled focuses on five census tracts touching the corridor once occupied by the Embarcadero Freeway. The amount, type, and quality of data tracked by the census improved drastically by 1990, so I’m going to focus on the change in the area from 1990 (shortly after the freeway was damaged) to the most recent census data. The availability of this information now allows me to track everything from population, to incomes, to home values, to percentage commuting by car or alternative modes of transportation, to amount of children, to percentage struggling or in poverty. The remainder of this post will walk through the history of the highway, it’s removal, and then highlight the disparity in socio-demographics before and after the highway.
Warning: This is about to get very wonky.
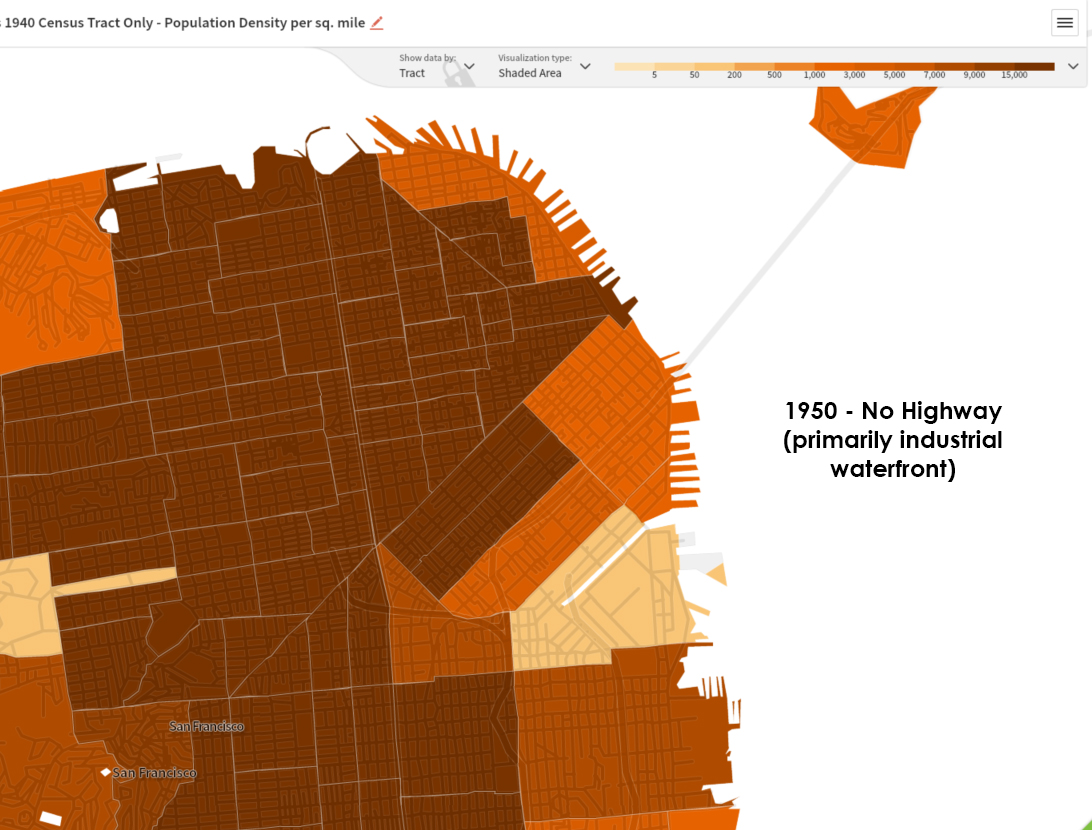
The above map is a heat map by census tracts showing population density. The darkest brown tips over 15,000 people per square mile while a medium shade of orange is somewhere in the vicinity of 3,000 to 5,000. Tan is likely under about 100/acre.
Ignore that the text on the map says 1950. This is actually from 1940. That’s a mistake I made when taking the screen grabs. Either way, it’s pre-highways. The area along the Embarcadero was also largely industrial waterfront, shipping and port facilities. Naturally, population density waned as you got closer to it because the majority of value was in the pre-war shipping industries, particularly where it is tan.
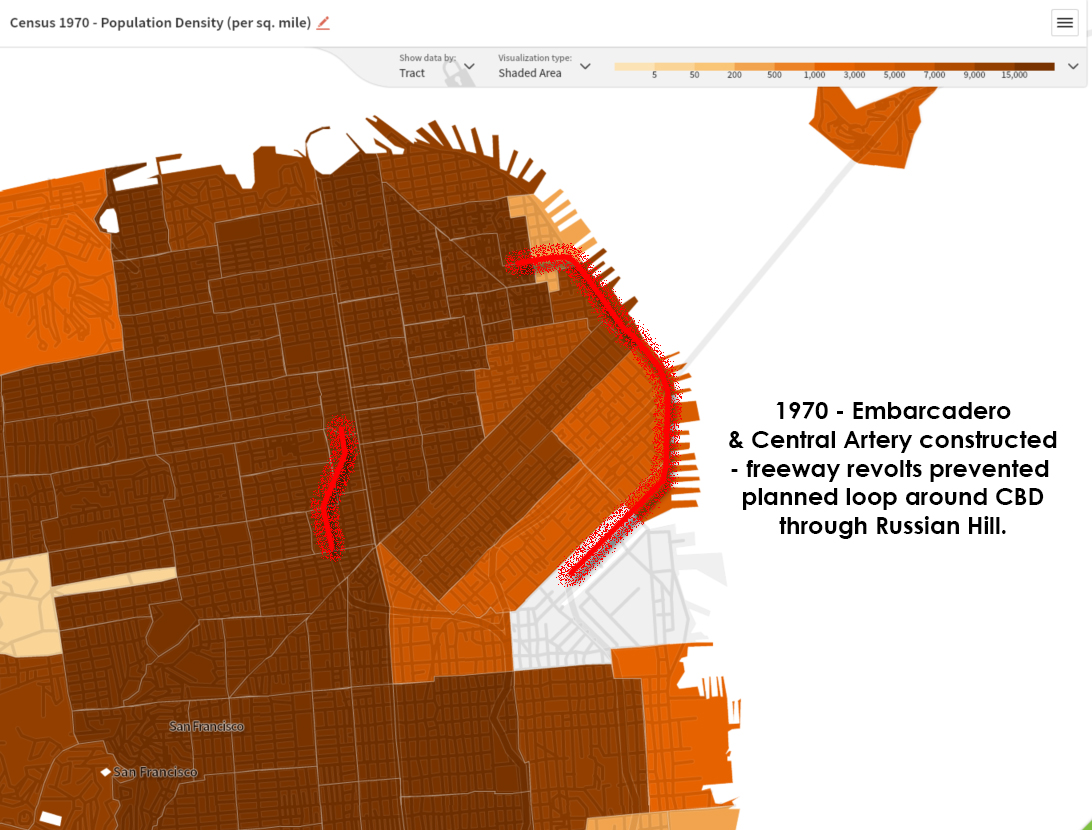
Then by 1970, the Embarcadero and the Central artery were built. These two roads were intended to create a loop. However, the freeway revolts prevented this loop from ever getting completed. The interesting thing is that the elevated portions were what was built. These were to be connected by a tunnel under Russian Hill. So while people often point out these highways were stubs and thus “easy” to remove, these same people were screaming that decommissioning them after the earthquake would cause gridlock (didn’t happen) and it was supposed to be a loop, but wasn’t due to neighborhood uprising.
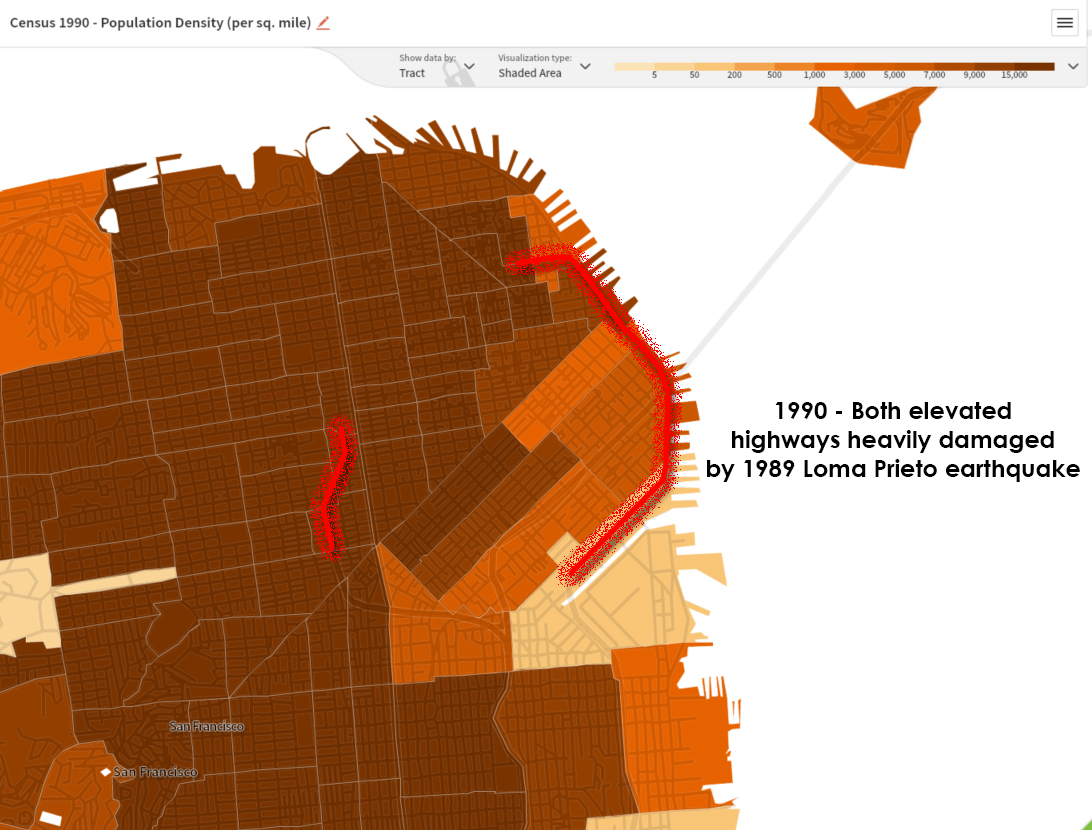
By 1990, both of these elevated freeways were damaged. By about 1996, the decision was made not to replace them, placing the city and its livability above its drivability, creating what is now known as the Embarcadero and Octavia Boulevard out of what was formerly the Central Artery. Furthermore, industry had already changed and there was less demand for industrial sector jobs in the downtown area. However, the real estate market hadn’t shifted demonstrably until these freeways were removed, making land more desirable and more in demand for a greater number of people looking to live closer to where they worked, an improved waterfront, and near transit.
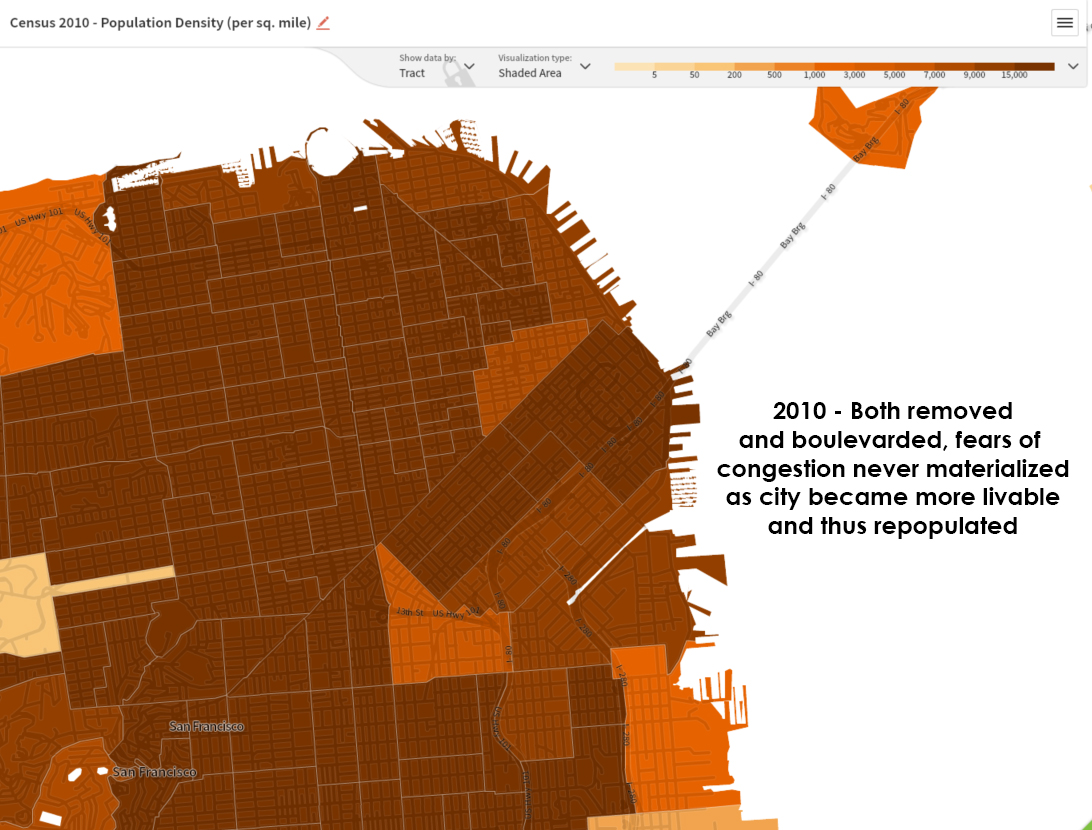
By 2010, without either freeway you can see how population density has increased significantly. The total population of census tracts 101, 105, 615, 607, and 180 along the Embarcadero in 1990 was 9229 residents over 2.37 square miles for a population density of 3887 people/sq mi. By 2010, the population had reached 31230, an increase of 22001, more than three times the previous population. The density for the entire area is now 13,154 people per square mile.
The amount that drove to work dropped from 38% to 32%. So despite increasing population nearly four-fold and reducing highway capacity, there were indeed more overall drivers (increase from 1968 daily drivers to 5102), but there was a reduced percentage of them and in all likelihood, because they were living closer to downtown job centers their trips were likely much, much shorter and thus more efficient and less likely to lead to congestion. More people walked to work, biked, or took transit thus taking more people off the road that would otherwise be “projected” drivers needing more highway capacity. Furthermore, because the grid can be restitched the local streets could handle fare more traffic because of the increase in route choice available. Urbanization suddenly makes everything function better.
Median home values (of owner occupied units) increased from 2000-2010 (not available before 2000) from 575k (in 2010 dollars) to 784k. Adding new population and increased home values added significant tax base to the area while stripping out cost burdens (the freeways). The area also added children, from 722 to 1578. Not quite as much as the overall population growth, but this still shows an increase in families not just the typical millennials or empty nesters.
Median incomes also increased significantly, rising from $36,252 (or $63749 in 2010 dollars) to $99,891. One might assume that means all of the poor people were simply pushed out, ie the bad kind of gentrification. However, when looking at the number of people living in poverty or struggling (the classification just above the poverty line), those numbers actually went up as well. In 1990, 2,372 people were living in this area and considered either in poverty or struggling. That number has gone up to 6,261 however the percentage of the total population has dropped from 25.7% to 20.05%. That tells me that the increase in density and wealth in the area also brings increased opportunity for those without as much as density and income increases brings with it significant demand for services and amenities.
While you might say, “hoo boy that’s some expensive housing,” keep in mind that housing costs are a product of incomes over a given area. You also must consider transportation costs in the calculation because all too often our policies from an infrastructural standpoint are aimed at lowering land costs (more infrastructure reaching a greater area = more land available for developer per capita = lower land costs). However, the lower land costs and more people spread out over a greater area significantly increases other costs and impacts such as transportation. As you can see below, cities that we think of having high housing costs are actually cheaper to live in in relation to local median incomes.
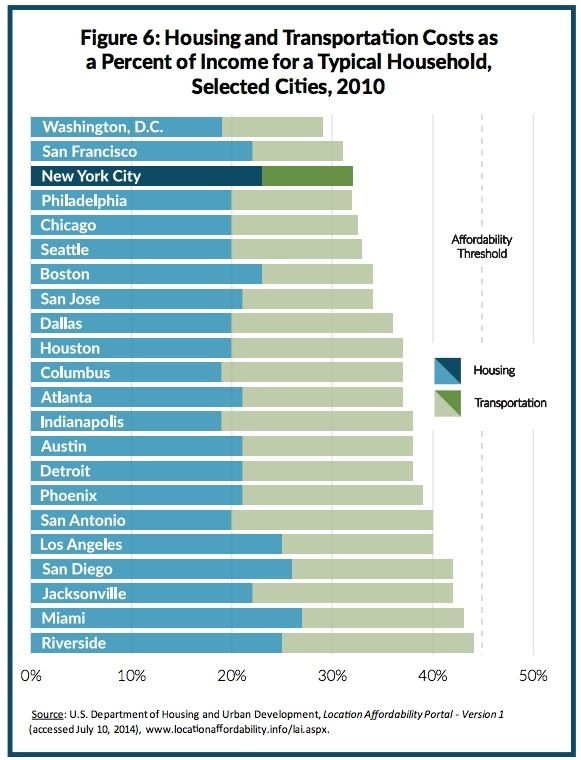
Higher land value is a product of demand. The more people that see opportunity and desirability in a given place. Actively designing transportation to deflate land costs is an exercise in institutionalized disinvestment, particularly in the urban core where density is most needed and wanted. We need higher land costs in the core in order to deliver density otherwise the development economics don’t work. Higher land costs = more density = more amenities nearby and the better transit is. Thus, paradoxically higher land costs actually yield greater affordability because mandatory car ownership is no longer part of the deal, particularly for those who can least afford it.