
In May, more than 40 people were murdered in Dallas, an unexplained spike from the 15 in May of last year. The investigation files crowded the desks of a skeleton homicide crew, prompting Dallas PD to boost the unit from 14 to 22 detectives. By mid-June, the number of homicides here had already notched over 100, on pace to surpass last year’s total of 196.
With election season behind us and City Council out for the summer, rhetoric around the issue has slowed. But it’s way too easy to find examples illustrating that the problem hasn’t gone anywhere.
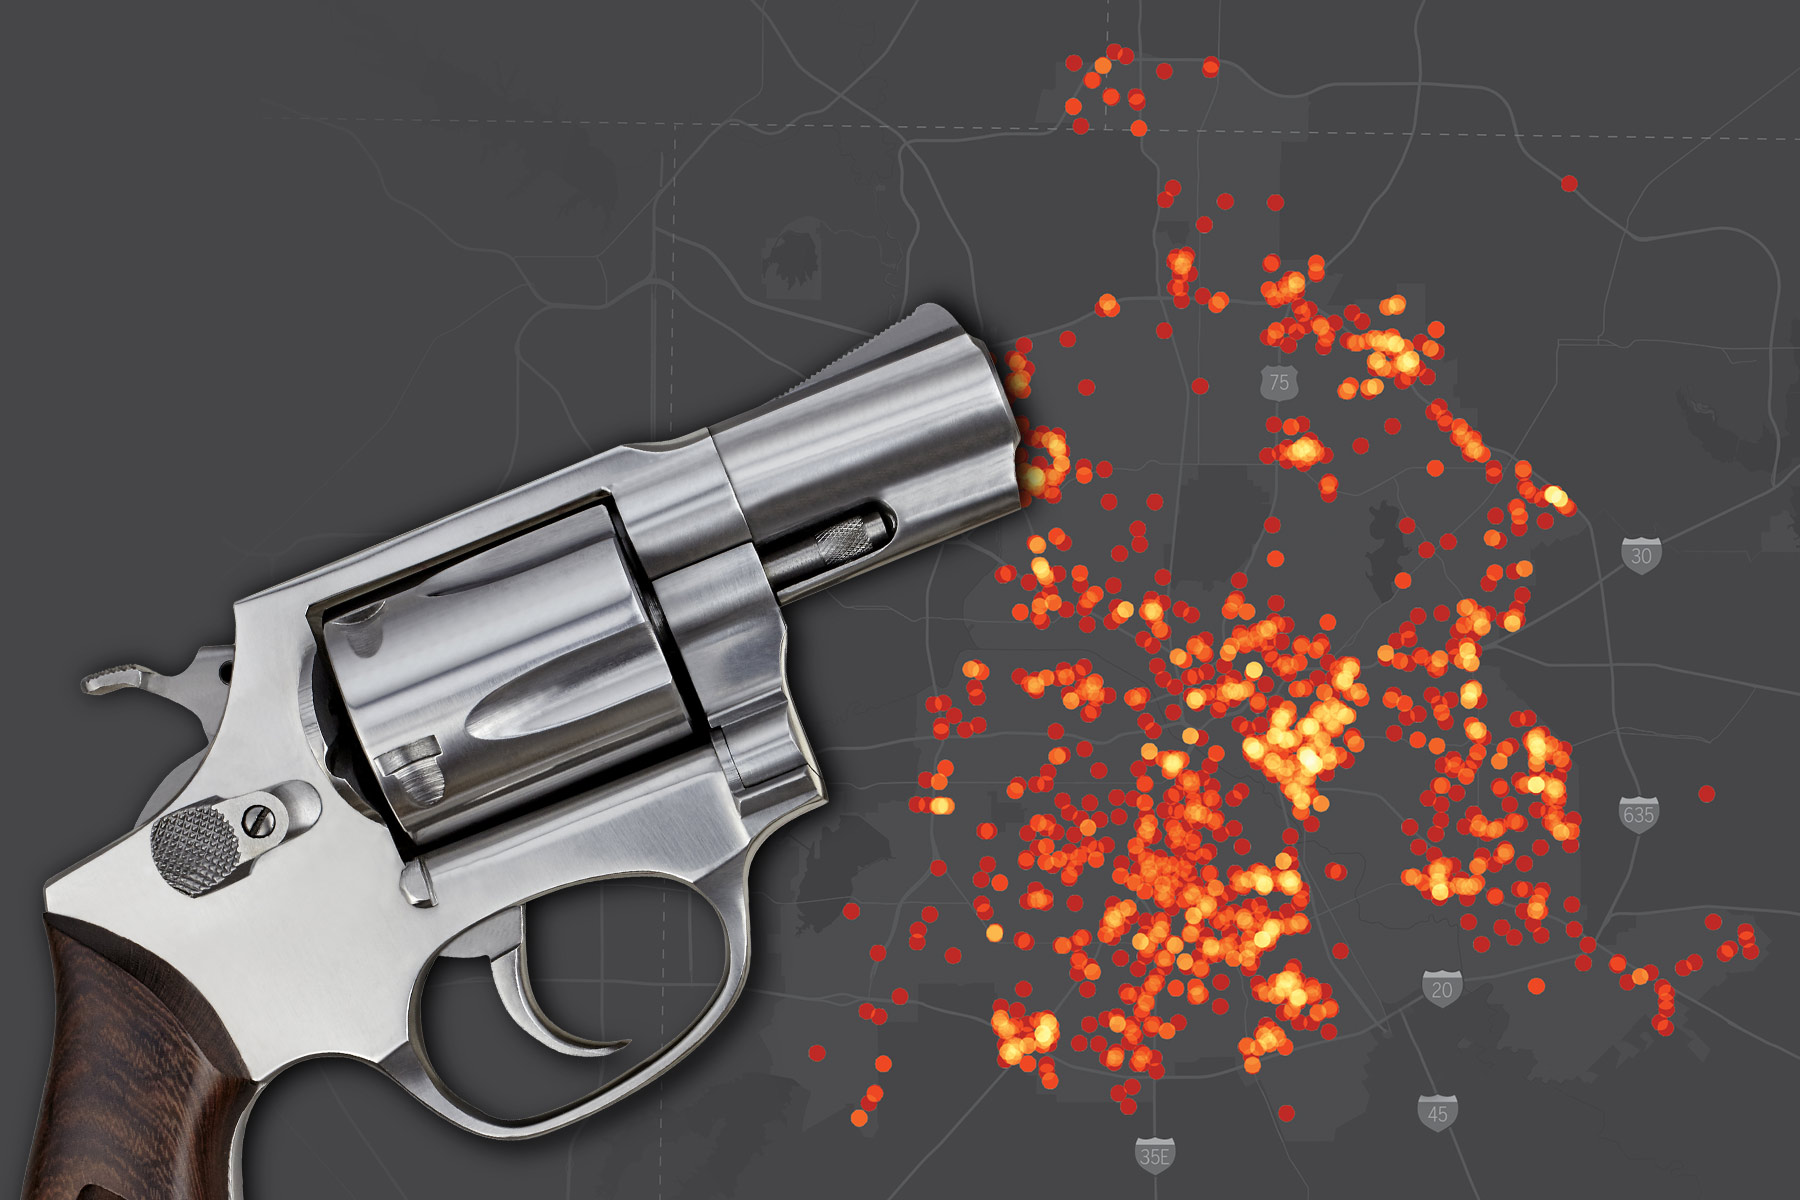
Not all of these killings involve guns. But gun violence has long stretched the city’s limited resources while leaving neighborhoods and families reeling from its effects. To get a grip on how deeply Dallas is impacted by gun violence, we analyzed five years of DPD incident data. The results are staggering. They show that on average, the city sees at least one gun-related murder or shooting involving an injury per day.
Over the past five years (June 2014 through May 2019), there have been at least 2,285 people injured by shootings in the city of Dallas. Of those people, 482 died. Because the city’s public incident data excludes sensitive records, such as offenses involving minors or sexual assault, the numbers are surely low. But the statistics presented here offer some of the most comprehensive tallies yet of how gun violence impacts our city.
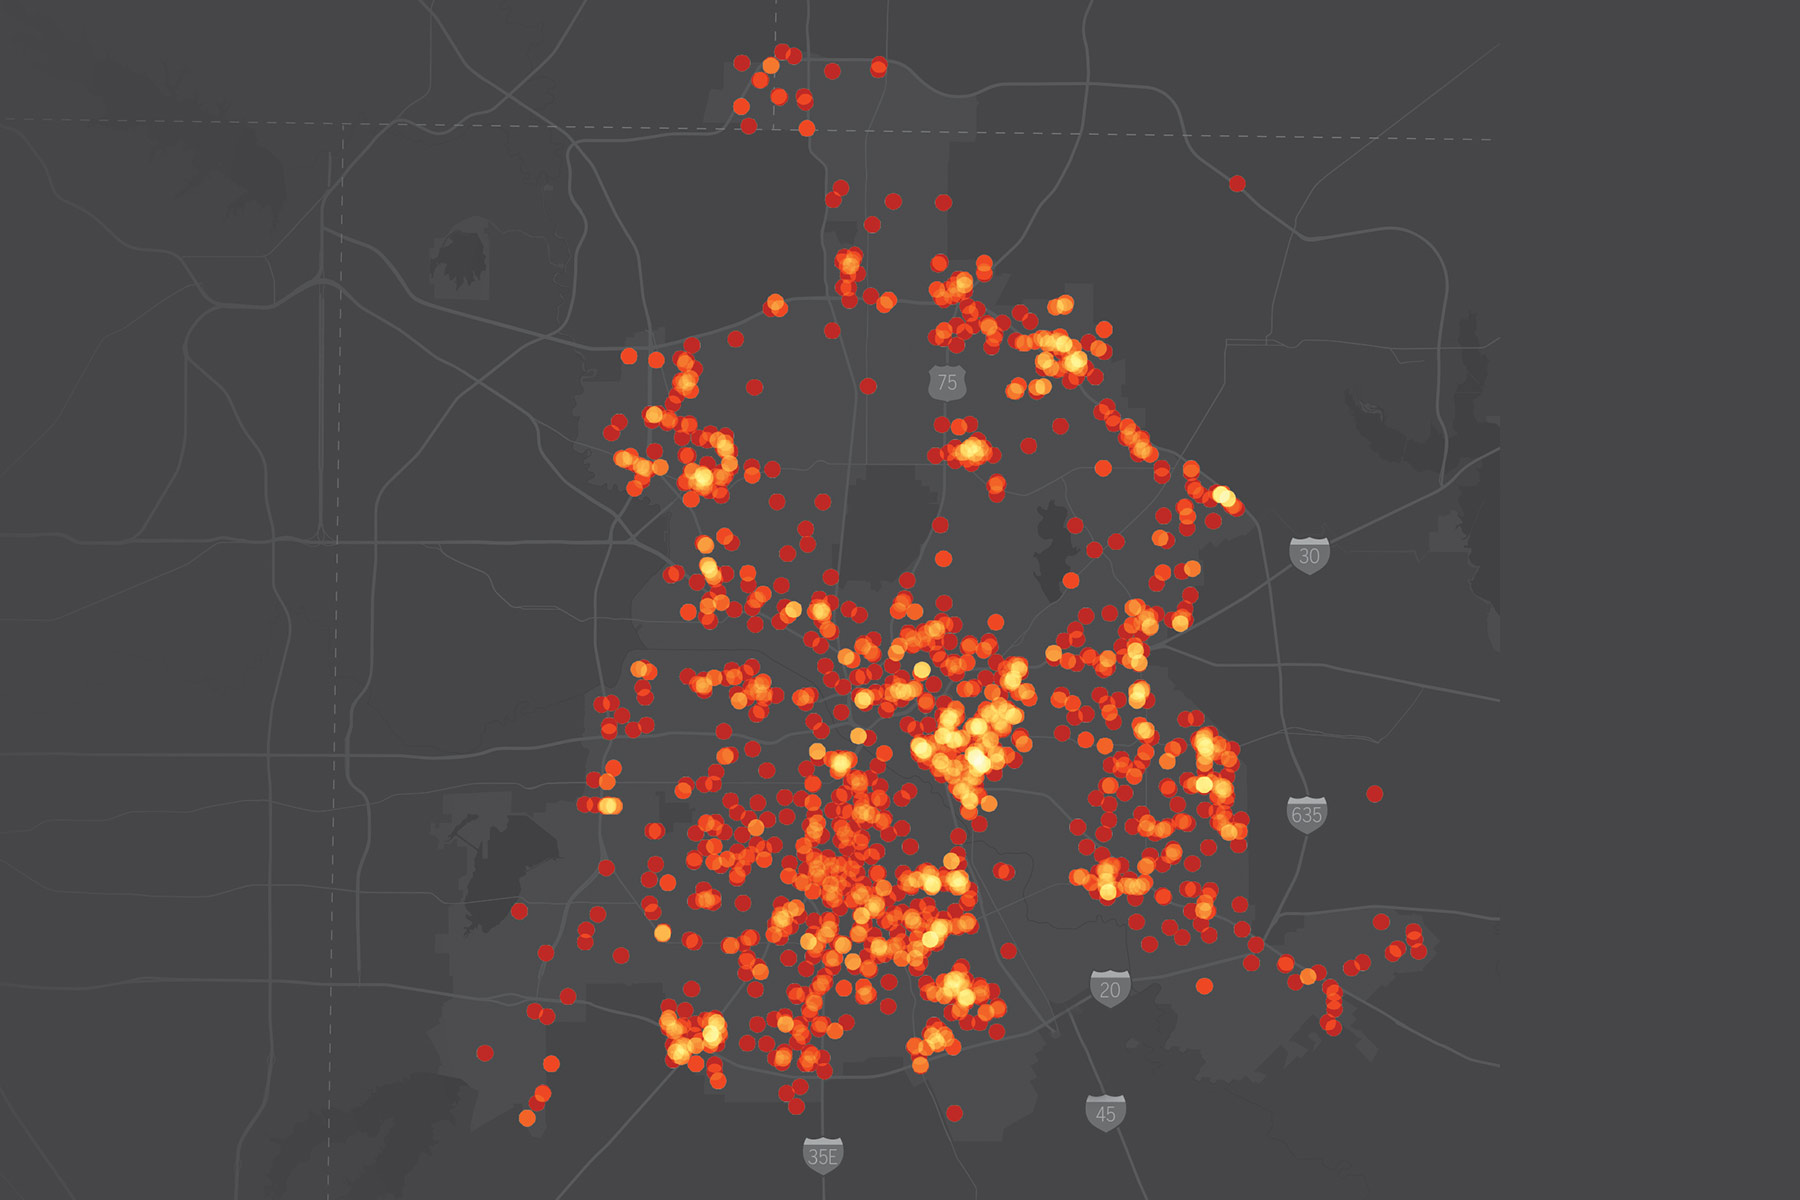
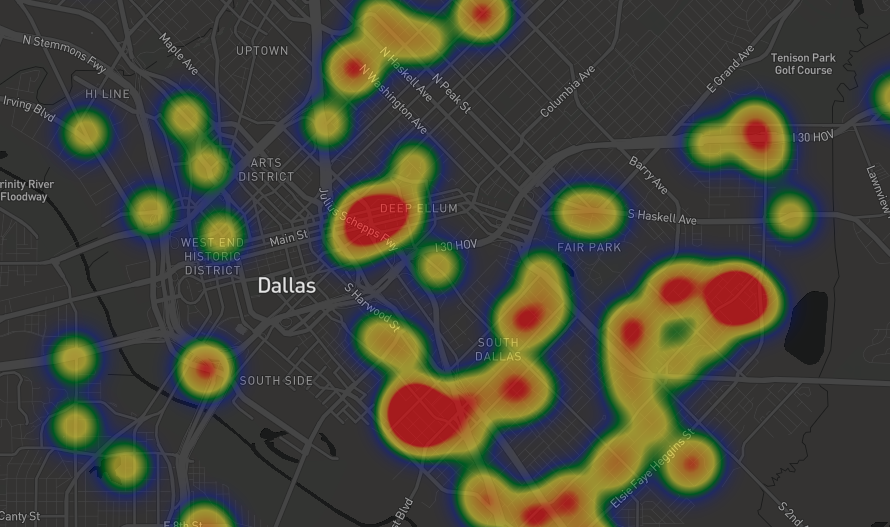
Here’s a heat map of where the shootings occurred over all five years:
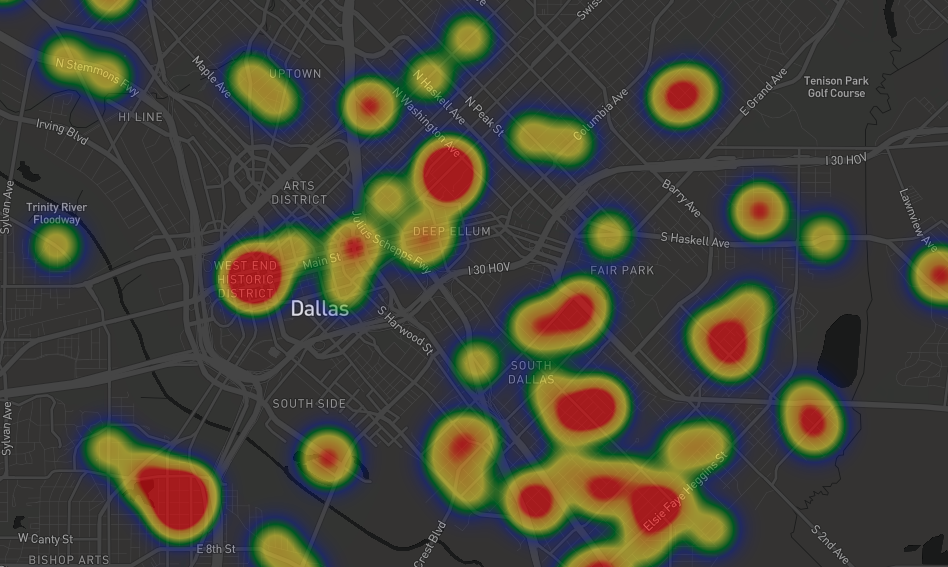
We’ve also worked with data researcher Robert Mundinger to map all this data online at his site, TheMap. There, you’re able to plainly see concentrated areas of gun violence as well as changes over time. There’s a heat map option and an option to view the incidents as individual markers, where you can click into each and read a little more information.
Here are a couple zoomed-in screenshots of those maps, showing how downtown, Deep Ellum, and South Dallas have changed during the last three years. You’ll notice shifts in places like the West End and Deep Ellum. At the neighborhood level, we’re talking smaller sample sizes, so keep that in mind.
Here’s 2016:
2017:
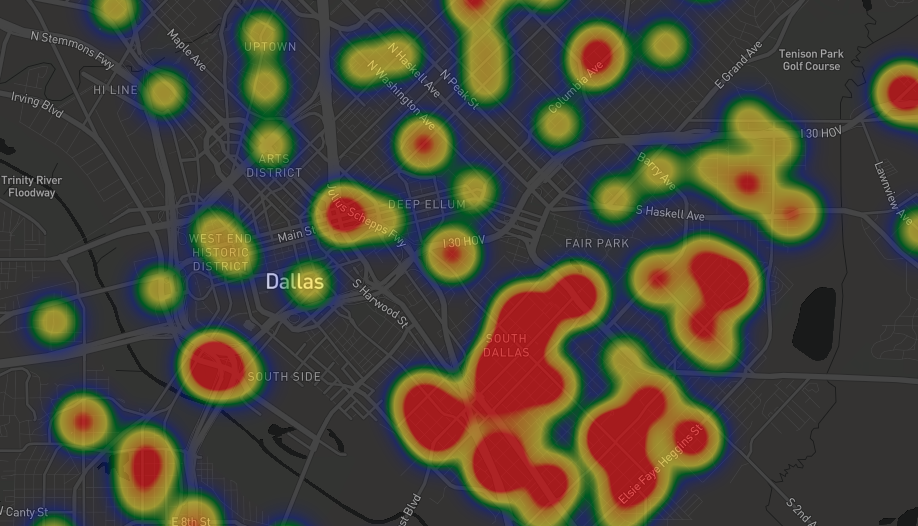
And 2018:
Other items of note:
• Even when looking solely at shootings over the last five years, May 2019 stands out. There were 79 total shootings during the month—15 more than the next highest month (Dallas hit 64 incidents twice, in July 2016 and December 2018).
• While the sheer volume of the incidents over the last half decade is stunning, the specifics are revelatory. They show a disproportionate impact of gun violence on the city’s black community, which makes up 24 percent of Dallas’ population yet suffers 64 percent of the city’s gun violence. About 55 percent of the total victims are black men.
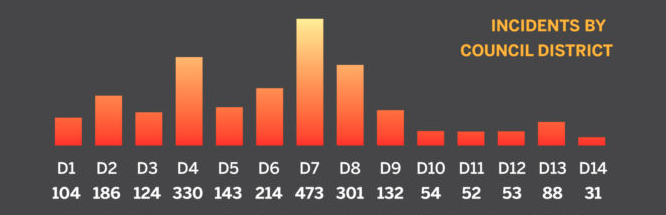
• The data also show the subtle shifts in where the incidents have occurred over the last half decade. The South Central police division had 83 incidents in 2015 before a significant jump to 125 a year later. Through the first five months of 2019, South Central saw 61 incidents, more than any other division in Dallas. That’s one more than the Southeast Division, home to the most shootings of any district over the last three years, at 129 (2016), 169 (2017), and 138 (2018). Find a map of the divisions here.
• Here’s how things break down by Council district:
• To create these maps, and before tossing the data to Mundinger, we weeded out incidents that might have otherwise found their way into an analysis of gun-related assault. Hundreds of times every year, Dallasites fire guns into the air or at homes, cars, or crowds without hitting victims. Other times, they brandish weapons without firing or use the butt of a gun to strike a victim in an attack.
We looked at incident descriptions to sort these incidents out. Had they been included, the toll of gun-related violence would swell by about three times.
Last year, The Trace published a map of the Gun Violence Archive’s massive repository of shootings. But finding apples-to-apples, hard-number comparisons of shooting tallies from one city to the next is difficult, because each city handles police data differently. When it comes to homicides, however, Dallas’ 196 murders last year is below Houston’s 269 but above San Antonio’s 106 and Austin’s 34.