
Dallas Crime Rates Through The Decades
Rates per 1,000 residents
Source: Dallas Police Department. City population estimates from U.S. Census
| Year | Murder | Rape | Robbery | Aggravated Assault | Burglary |
|---|---|---|---|---|---|
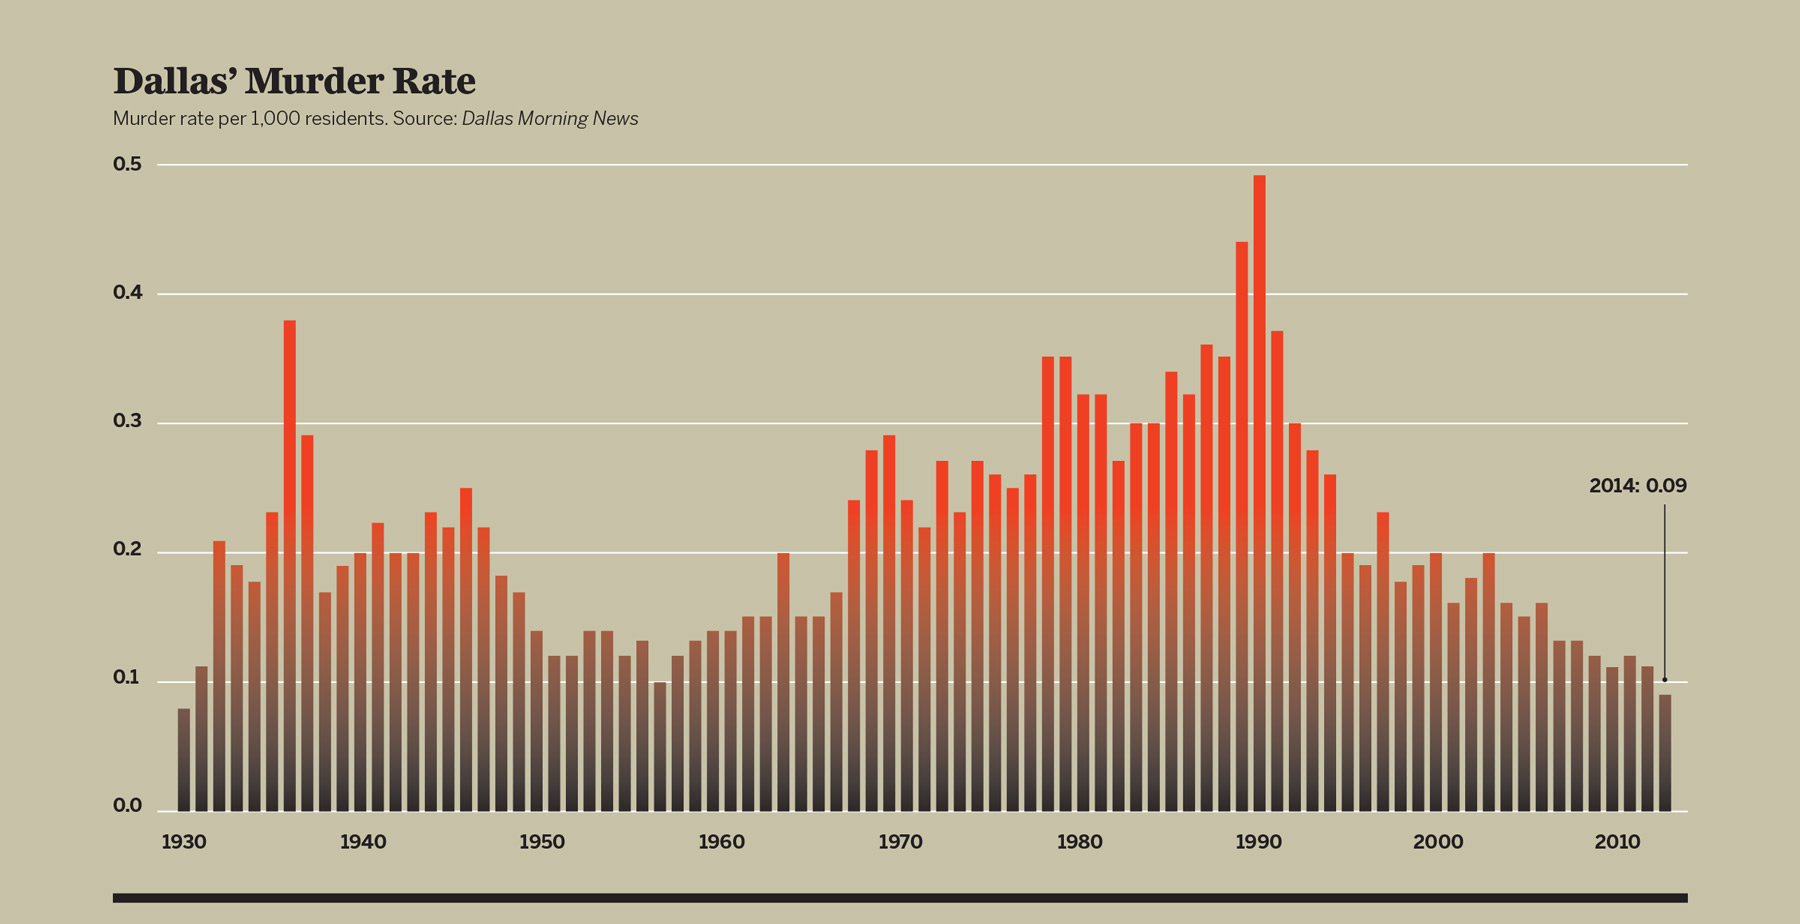
| 1945 | 0.13 | 0.10 | 0.35 | 1.23 | 1.10 |
| 1953 | 0.14 | 0.09 | 0.30 | 0.41 | 1.68 |
| 1963 | 0.15 | 0.07 | 0.26 | 0.89 | 1.89 |
| 1975 | 0.25 | 0.25 | 1.28 | 1.49 | 4.70 |
| 1995 | 0.09 | 0.25 | 0.88 | 2.17 | 0.90 |
| 2014 | 0.09 | 0.61 | 3.01 | 2.89 | 9.12 |
Crime Through The Decades
Source: Dallas Police Department. City population estimates from U.S. Census
| Year | Population | Murders | Rapes | Robberies | Aggravated Assaults | Burglaries |
|---|---|---|---|---|---|---|
| 1945 | 364,598 | 46 | 36 | 128 | 447 | 401 |
| 1953 | 508,029 | 72 | 44 | 151 | 210 | 856 |
| 1963 | 729,099 | 107 | 52 | 193 | 646 | 1,377 |
| 1975 | 874,240 | 220 | 217 | 1,119 | 1,300 | 4,107 |
| 1995 | 1,040,492 | 95 | 258 | 920 | 2,262 | 933 |
| 2014 | 1,281,047 | 116 | 781 | 3,856 | 3,704 | 11,685 |
Get the D Brief Newsletter
Dallas’ most important news stories of the week, delivered to your inbox each Sunday.