
The suburban schools are bursting at the seams. In Piano, for example, there were 17,428 students enrolled last year, a figure that doesn’t mean much until you realize that five years ago, in the 1971-72 school year, there were only 7,870 students in Piano schools. From 1968 to 1972, the Piano district grew by 115 percent, and the growth rate is a fairly constant 12 to 13 percent each year. By 1981-82, Piano will be instructing 30,000 kids.
Piano’s growth is symptomatic of the attractiveness that suburbia still holds for a great many people, despite very real strides in inner-city revitalization and the impact of high fuel costs on commuters. Around many suburban school districts a mystique has developed, a reputation for excellence that may or may not be justified. The first things a prospective home-buyer has to cope with, especially if he’s just transferred to Dallas from Buffalo or Baltimore or Boise, are the myths and the misinformation.
“Buy a house in Piano,” he’s told by someone in the office. “They have the best schools in the area.” The realtor urges Richardson. A cousin from Houston says it’s worth paying the premium just to get the kids into the Park Cities schools. But Irving is closer to the corporate offices, and somebody else says that Coppell is going to be the next boom town – buy a house there and double your investment overnight, he’s told.
Just find out which one is really the best, insists his wife.
But what makes a school district the best? The first block against finding the “best” is deciding what sort of education you’re looking for. Coppell Independent School District encompasses the small town of the same name, northwest of Dallas. It takes pride in what it considers an adequate comprehensive education, the kind that only a small town can offer. It cannot and would not compete with a district like the neighboring Carrollton-Farmers Branch ISD. Carrollton-Farmers Branch is a fast-growing community of upwardly mobile families who want strong vocational programs and innovative teaching techniques. Coppell has neither the resources nor the population to support such programs and, more important, simply has no need for them.
Even when two districts of similar background and aim are isolated, valid and useful comparisons are difficult. Richardson and Piano are both upper middle class white suburbs. Standardized test scores indicate their students to be well above national averages, so the need for more modern, innovative schooling is more pronounced than in other districts. Piano offers two and three-hour vocational blocks, covering not only automotive mechanics and other long-time vocational courses, but moving into more academic blocks like journalism, chemistry, law, and social work. Carrollton-Farmers Branch has had even more success with a similar career education innovation. Richardson employs a great variety of special facilities to diversify its course range, even using a planetarium to teach astronomy.
The differences in approach among the districts bring up one very clear point: money and education are inextricably mixed. It is certainly no coincidence that the most progressive, modern school districts are in the northern suburbs, where the money is. The children of the wealthier professionals who live there invariably are the highest-scoring group in tests; their career goals are higher; they require a broader education to meet those goals. And they have the money to pay for that education. Highland Park ISD proves this premise on another scale. It is too small to use broad vocational programs, so it directs itself toward preparing the student for his next step, college. Their college prep program is exceptional – 94.6 percent of last year’s graduates went on to college. In most Highland Park families only one parent works, so the other is free to be more active in the school, through PTA, Dad’s Club, and volunteer work. For example, of the 455 children in one Park Cities elementary last year, 452 had parents in the PTA. Allowing for brothers and sisters in the school, that still leaves an astonishing rate of participation. An even better illustration is the fact that the Park Cities school cafeterias are staffed entirely by PTA volunteers. In the lower income districts, both parents often have to work, so free time is scarcer.
A comparison of something as subjective as the quality of education a school district offers is, of course, impossible without total familiarity with all districts involved. All 15 are independent school districts, so no coordinating body or individual is qualified to say which one gives a student the best education.
A useful comparison, then, is obtainable only by certain fixed criteria. Some are cut-and-dried numbers games, such as per pupil expenditure, number of National Merit competition finalists, and percentage of faculty holding advanced degrees – statistics that, taken individually, have arguable bearing on the “quality of education.” But considered together, these numbers are important. Other measures are more direct, like standardized test scores, student-teacher ratios, and percentage of graduates that enter college.
Our criteria are split into three categories: (1) money, (2) students, and (3) teachers and parents, plus an explanation of some of the extra programs and facilities that each district likes to crow about.
“Money” takes in three things. Per pupil expenditure is the amount budgeted for the district’s operation divided by average daily attendance. That excludes debt service (payments on loans) and capital outlay (construction costs, purchase of land, vehicles, and other supply acquisitions). Listed with per pupil expenditure is a “PAR” figure, computed by the Texas Research League, of that district’s expenditure per student compared to the statewide average. A tigure of 100 is average. A higher score technically indicates more money available per student; a lower figure, less. The second part of “money” is the tax rate adopted by the district, along with the assessment rate. That rate is a dollar figure per $100 of the assessed value. The first two divisions are 1976-77 figures. The third is the average teacher salary in the 1975-76 year, along with the percentage by which this figure exceeds the state minimum. The relevance of this third division is obvious. If a district can afford to pay more, it has a better potential to attract more experienced and qualified teachers.
The second grouping, “students,” involves several sets of numbers. First, the average annual drop-out rate. This can often be a misleading figure because there are several ways of calculating it. Some districts use average daily attendance figures for nine months of school; others include the summer off-periods. Some use only high school dropouts for the total; others use seventh grade or even elementary grades. The rates given here are for grades 9-12 during the school months unless otherwise noted. The dropout rate reflects the students’ motivation to learn and, often, the faculty’s ability to create and channel that motivation. Ultimately, it could show whether a school is interesting enough to make a student feel he can get more by staying in than getting out. But, as one administrator pointed out, a district that reports a high dropout rate may not actually have the highest; it may just be the best at calculating it. The second figure is the number of finalists in last year’s National Merit Scholarship competition. They are determined by scores on the Scholastic Aptitude Test, taken by most high school seniors and required by most colleges. Winners are not determined by scores beyond the finalist point, so only the number of finalists is given. The number of finalists and winners attending is commonly used by colleges as an attractive statistic in profiles and brochures. The third factor is the average percentage of high school graduates that continue their education beyond graduation, including two and four-year colleges and universities, technical schools, and nursing schools. The corollary here is evident. Did the school convince the student that a solid education really is beneficial? Did it help the student get a focus on what he wants to do, so he can go to the best place for his needs? The last area under this category is standardized test scores. So many different tests are given at so many grade levels that a direct comparison between the districts would be not only unfair but meaningless. The tests are all scored differently and cover varying areas. All of the tests used, however, included at least three basic subjects: reading, language arts, and math. Some add science and social studies; others subdivide each subject (concepts plus computation equals mathematics total). For comparative purposes, the performance of each district’s students is graded against the national norms for that test. Test results are the easiest and clearest means of measuring the quality of students, even though they can’t take into consideration the student who just had “a bad day” the day of the testing, or the child who simply chokes up with nervousness when he’s handed a test. Still, a school is only as good as the students in it, and no tool is more revealing than a test.
“Teachers and parents” encompasses three things. The percentage of the faculty (including administrators) holding Master’s Degrees. (All teachers are required to hold a Bachelor’s Degree.) Although it is recognized that some of the best teachers do not possess anything above a B.A., the level of education of a teacher does show the depth of his knowledge and experience in a subject, and might mean an extra dedication to learning. A high percentage of Master’s demonstrates a concern in the administration to bring the best teachers they can find to their schools.
The second item is the student-teacher ratio in the 1975-76 year. This is actually the number of teachers divided by the number of students in average daily attendance. It is used as a guideline in estimating the typical size of a class, though actual size can range far either way from this figure. A high figure could mean a need for more teachers, or overcrowded conditions in the schools. Both are detrimental to educational quality, since a small class is almost always a better atmosphere for learning. The state average for this is 17.6 to one. The third division is parent and volunteer involvement, detailing student enrollment / PTA membership count ratios and volunteer aide programs and clubs. A parent’s interest in a child’s education is one of the best resources a school can draw on. It means time and money to the school. Parents are the watchdogs of every aspect of a school, from the condition of the playground to the scoring of a spelling test. An active PTA can do more for a school than its principal can, and caring parents at home are an unquestioned advantage to a student.
The last section is each district’s opportunity to explain why they are “the best.” It entails special programs, unique courses, particular emphases, and a lot of enthusiasm.
Facts have a way of getting twisted and turned to create almost any impression, so we’ll just lay them out and let the interpretations rise.
But here’s another fact. Though the Dallas Independent School District was not included in this study (for obvious reasons), it would not have taken a beating. Blow for blow, the much-maligned DISD had almost every other district beaten in most categories.
CARROLLTON-FARMERS BRANCH
Money
Per pupil expenditure: $1,112. PAR 92.
Tax/ Assessment rate: $1.50 at 55%.
Average teacher salary: $11,188; 10.4% over state minimum.
Students
Dropout rate: 5% annually, though this will probably decrease with the continued operation of a new alternative school.
National Merit finalists: 6.
Higher education rate: 69%.
Standardized test scores: Standard Achievement Test by the Psychological Corporation. Included were several subtests under three main divisions: reading, math, and auditory. With grade equivalent norms of x.0, the 2nd, 4th, 6th, and 8th grades scored composite equivalents of 2.4, 4.0, 6.4, and 8.4 respectively. The tenth graders were graded in scale scores, with Reading, English, and Mathematics norms of 195, 202, and 1% respectively. The Carroll-ton-Farmers Branch students scored 193, 203, and 198.
Teachers and Parents
Advanced degrees: 32% Master’s.
Student-teacher ratio: 17.6 to one.
Parental involvement: Ratio of PTA count to student count is estimated at 1.5 to one. Story telling, reading, and listening to children read are the main classroom services of volunteers. Typing and making instructional aides are also volunteer jobs. The district is beginning a parent training program to help professionalize voluntary services.
And Otherwise
Carrollton-Farmers Branch is huffing and puffing to get all of its newness together. They have a brand new high school, the beautiful, modernistic Newman Smith H.S. The recently opened alternative school is lowering the dropout rate, allowing students a fresh start with a program and staff geared to their problems. This gives other students with discipline problems a place to go instead of just “out.” Along with this, a new “reassignment” school will carry on temporary classes for suspended students, who would previously have been sent home for three days or more. Carrollton has a strong, large vocational block program, including job training for the handicapped.
CEDAR HILL
Money
Per pupil expenditure: $1,211. PAR 100.
Tax/ Assessment rate: $1.33 at 75%.
Average teacher salary: $10,801; 8.7% over state minimum.
Students
Dropout rale: 5%.
National Merit finalists: none.
Higher education rate: 52%.
Standardized test scores: Science Research Associates test. Includes reading, language arts, and math at all levels, plus social studies, science, and use of sources starting with the fourth grade. No district-wide composite scores were available, but growth scale charts show 1-5 grades at Bray Elementary slightly above national norms. The same grades at South Hills Elementary scored consistently at or a little below national norms on composites, but slightly above on the reading subtest, a result of Cedar Hill’s strong reading emphasis. Grades 6-9 and 11 all scored below norms overall, but above on reading. Grade 10 was right at the norm, and grade 12 was below the norm in all subtests.
Teachers and Parents
Advanced degrees: 29% Master’s.
Student-teacher ratio: 18.8 to one.
Parental involvement: The ratio of student body to PTA members is about 4.6 to one. Volunteers are also used in offices, libraries, and as teacher aides in elementary schools.
And Otherwise
Cedar Hill ISD is growing by 5-10% annually, but is still a small-town, comprehensive offering. They are presently constructing a new high school which should be ready for the 1978-79 year. Emphasis in the curriculum is on the basics: reading and math. Their Systems Directed Reading program has increased test scores and overall reading levels. An unusually extensive math program for a district this size has produced many winners in mathematics competitions and has, again, upped the test score levels overall.
COPPELL
Money
Per pupil expenditure: $1,527. PAR 126.
Tax/Assessment rale: $1.10 at 50%.
A verage teacher salary: $11,139; 10.3% above state minimum.
Students
Dropout rate: 5.5%
National Merit finalists: 0.
Higher education rate: 60%.
Standardized test scores: not available. They could not be located.
Teachers and Parents
Advanced degrees: 52% Master’s.
Student-teacher ratio: 13.9 to one.
Parental involvement: Only high school PTA figures available; ratio of student enrollment to members is 2.7 to one. The libraries are manned by volunteers, and a parents organization helps support and equip the band.
And Otherwise
Coppell may well be the next boom town. That sort of thing is unpredictable. But the schools are definitely on a small scale now, as they should be. The district offers a basic, comprehensive curriculum – not much flourish, but a good, solid baseline education.
DESOTO
Money
Per pupil expenditure: $1,052. PAR 87.
Ta /Assessment rate: $1.52 at 65%.
Average teacher salary: $10,825; 9.7% above state minimum.
Students
Dropout rale: 3-5%.
National Merit finalists: 0.
Higher education rate: 50%.
Standardized test scores: Science Research Associates test, scored in percentiles. Composite percentile rankings for grades 2,4,5, and 7 were 59, 63, 63, and 50, respectively.
Teachers and Parents
Advanced degrees: 37.3%.
Student-teacher ratio: 20.2 to one.
Parental involvement: PTA figures unavailable. Volunteer groups are very active in DeSoto. The All-Sport Club, composed of fathers, helps raise money to equip and support athletic teams. The PTA sponsors parent volunteer programs, and band boosters and room mothers are fixtures in the district. A nursing assistance program rounds out the volunteer participation.
And Otherwise
The self-described aim of the DeSoto ISD is to provide a “well-rounded educational system.” DeSoto is a small-town district with a small town fare – not stagnant, just consistent. One unusual item is a phased high school English program that mixes all grade levels, grouping only by ability, so that the pace is left up to the student. Similar teaching styles are now in use in science and in a conceptual history course.
DUNCANVILLE
Money
Per pupil expenditure: $936. PAR 77.
Tax/ Assessment rate: $1.56 at 65%.
Average teacher salary: $10,825; 9.7% above state minimum.
Students
Dropout rate: 3-5%.
National Merit finalists: 3.
Higher education rate: 60-70%.
Standardized test scores: Iowa Test of Basic Skills, including vocabulary and reading, language skills, work study, and math. The 3rd grade scored a composite percentile of 82, the 4th grade scored 67, and the 5th scored 46.
Teachers and Parents
Advanced degrees: 37.2%.
Student-teacher ratio: 19.4 to one.
Parental involvement. Ratio of student total to PTA membership is 2.14. Individual school clinics have volunteer assistants. Volunteers also help in giving standardized tests to students.And Otherwise
Duncanville ISD staffers are better administrators than salesmen. They sum up the district’s offerings as “a comprehensive program with some vocational emphasis.” We call that a basic education in a small district, and that’s exactly what a lot of people want.
GARLAND
Money
Per pupil expenditure: $1,065. PAR 88.Tax/Assessment rate: $1.94 at 60%.Average teacher salary: $11,083; 8.8% over state minimum.
Students
Dropout rate: 4%.
National Merit finalists: 4.
Higher education rate: 55%.
Standardized test scores: Iowa Test of Basic Skills, including Vocabulary, Word Analysis, Language Skills, Work Study, and Math sub-tests. Given to grades 1, 3, and 5, and scored in grade equivalents.
Grade Norm Garland score1 1.8 1.91 3 3.5 3.55
5 5.5 5.3
Teachers and Parents
Advanced degrees: 50% Master’s.
Student-teacher ratio: 19.2 to one.
Parental involvement: Student enrollment to PTA membership ratio is 2.4. The major area of volunteer involvement is in the nursing staff.
And Otherwise
Surprisingly, all of the suburban population boom is not directly north of Dallas. An administrator in the Garland ISD estimates Garland to be easily “the fastest growing district” in the area. Garland’s claim to fame is its special services offering. The Cooperative Student Care Program is designed to educate the handicapped that cannot function in normal schools and would otherwise have to be in private institutions. Special schools are equipped to handle the complicated problems of all types of handicapped, teaching not only the usual staples but training them in jobs they are able to do. This is a cooperative program of the Garland, Richardson, Piano, and Carrollton-Farmers Branch districts, but three of the four schools are located in Garland. Garland also operates separate special services for other blind and deaf students.
GRAND PRAIRIE
Money
Per pupil expenditure: $1,075. PAR 89.
Tax/Assessment rale: $1.47 at 65%.
Average teacher salary: $10,960; 10.5% over state minimum.
Students
Dropout rate: 7%. Grand Prairie’s figures include dropouts, people who moved out without reporting, and some who never returned from summer recess. The actual dropout figures are lower than 7%.
National Merit finalists: 2
Higher education rate: 68%.
Standardized test scores: Comprehensive Test of Basic Skills. Given in October or November to grades 9 and 11 and scored in grade equivalents, with norms of 9.2 and 11.2. Subtests were: Reading 9.6 and 11.4. Language Arts 9.6 and 11.4, Math 9.0 and 10.5, Reference Skills 9.6 and 11.4, Science 9.4 and 11.4, and Social Studies 9.8 and 11.4. All above average except math.
Teachers and Students
Advanced degrees: 60-70% Masters.
Student-teacher ratio: 19.9 to one.
Parental involvement: Ratio of total student enrollment to PTA members is 2.6 to one, a high participation rate. Volunteer assistants help in reading and math in classrooms, writing instructional materials, supervising field trips, and clerical work.
And Otherwise
Grand Prairie ISD isn’t setting any records for innovation, but they do have a number of unusual facilities. A bilingual K-4 program offers help to students who can’t get along normally, as does the Shady’Grove Learning Center for the Handicapped. A planetarium adds new dimensions to curriculum, and elementary team teaching and an open classroom approach in 40% of the schools help modernize the district. Administrators stress reading and math in the schools.
HIGHLAND PARK
Money
Per pupil expenditure: $1,437. PAR 118. Tax/Assessment rate: $1.83 at 47%. (The assessment rate is expected to increase to 75% this school year, with the rate per $100 adjusted downward to keep the tax at about the same level.)
Average teacher salary: $12,628; 13.5% above state minimum.
Students
Dropout rate: 1.3%.
National Merit finalists: 19.
Higher education rate: 94.6%.
Standardized test scores: Highland Park ISD Superintendent Winston Power, Jr. refused to release the district composite test scores.
Teachers and Parents
Advanced degrees: 80% Master’s.
Student-teacher ratio: 6.0 to one.
Parental involvement: Complete figures unavailable, but the percentage of parent participation at the elementary levels is consistently between 95 and 100 percent. The number of volunteers and the extent of volunteer programs in Highland Park ISD is phenomenal. All school cafeterias are staffed entirely by PTA volunteers, as are elementary school supply rooms. The Park Cities Dads Clubs purchase equipment for athletics and other school programs, and provides financial support for teacher workshops.
And Otherwise
Highland Park schools are traditional to the point of being sacrosanct. But if they’ve been doing the same thing all these years, at least they’ve got it down pat. The focus of a Highland Park public school education is preparation for college. They have certainly the premier college prep program in this area and excellent advanced placement programs for college credit. With a college placement rate of 94.6%, they know what they’re doing.
IRVING
Money
Per pupil expenditure: $1,130. PAR 93.
Tax/Assessment rate: $1.45 at 60%.
Average teacher salary: $11,465; 13.6% over state minimum.
Students
Dropout rate: 6%.
National Merit finalists: 6.
Higher education rate: 55%.
Standardized test scores: Science Research Associates test. Scored in percentiles, with 50 as the norm.
Grade Language Arts Reading Math
1 77 69 76
2 66 70 63
3 60 63 60
4 55 58 57
5 59 55 54
On the Comprehensive Test of Basic Skills, with a grade equivalent norm of 8.0, Irving 8th graders rated 9.8, 9.9, and 9.5 on reading, language, and math subtests, respectively.
Teachers and Parents Advanced degrees: 35% Master’s.
Student-teacher ratio: 19.5 to one.
Parental involvement: The ratio of student enrollment to PTA members is 2.1 to one. A career education program involves over 300 volunteers who visit schools to talk about all aspects of their business. Elementary libraries are staffed largely by volunteers.And Otherwise
Irving is particularly impressive in statistics, with good test scores and PTA membership. It is a large district, with not a large degree of diversity in its programs. The Project Business Program, mentioned above, is one step toward career education and community involvement in the educational process. Administrators plan an intensification this year in reading and composition, grammar, and math.
LANCASTER
Money
Per pupil expenditure: $1,127. PAR 93.
Tax/Assessment rate: $1.65 at 70%.
Average teacher’s salary: $11,179; 7.9% above state minimum.
Students
Dropout rate: Less then 1%.
National Merit finalists: one.
Higher education rate: 45%.
Standardized test scores: Science Research Associates achievement test, with reading, Language Arts, and Math subtests. Tests were given at the beginning of the year, so the grade equivalent norms were the grade level plus one month (x.1). Grades 2, 5, and 8 scored composite equivalents of 2.6, 5.4, and 8.3 respectively. The 1lth grade was graded in per-centiles, scoring a composite 55 percentile, above the norm of 50.
Teachers and Parents
Advanced degrees: 46.9% Master’s.
Student-teacher ratio: 17.1 to one.
Parental involvement: Ratio of PTA members to student count is 2.4 to one. Adult volunteers aid teachers in elementary schools; others work in elementary libraries. High school students also volunteer as tutors to work with elementary students during daily high school off periods.
And Otherwise
The Lancaster school officials don’t emphasize any one aspect of their fare, preferring to point to their “overall academic quality.” They do stress, however, basic elementary reading standards.
MESQUITE
Money
Per pupil expenditure: $945. PAR 78.
Tax/Assessment rate: $1.44 at 85%.
Average teacher salary: $11,411; 10.6% over state minimum.
Students
Dropout rate: 4.8% for grades 7-12.
National Merit finalists: 4
Higher education rate: 60%.
Standardized test scores: Science Research Associates. Scored in grade groupings of 1-3 and 4-6. The first grouping scored grade equivalent of 3.4 compared to a national norm of 2.8. The other group scored 6.5 to a norm of 5.8.
Teachers and Parents
Advanced degrees: 55% Master’s.
Student-teacher ratio: 20.7 to one.
Parental involvement: Student count to PTA membership ratio is 1.9. Volunteers work as classroom assistants, listening to children read, making charts, and tutoring.
And Otherwise
Mesquite ISD looks to be on the upswing. It seems to have a strong lean toward traditional education, and the quality of that is not assessable. Unique facilities and ideas are not many, but the four-channel television system and the planetarium studies are standouts. Television shows are mostly produced locally.
PLANO
Money
Per pupil expenditure: $1,079. PAR 89.
Tax/Assessment rate: $1.72 at 70%.
Average teacher salary: $11,069; 13.9% over state minimum.
Students
Dropout rate: 2%.
National Merit finalists: 7.
Higher educational rate: 70%.
Standardized test scores: Comprehensive Test of Basic Skills, given in March 1977 to grades 1-8, 10, and 12. It was scored in grade equivalents, so the national norms were for the sixth month of the grade year. In other words, the average first grader nationally scored at the one year, sixth month level. Since there are roughly ten months in the school year, this means a decimal norm of 1.6. Seniors were scored in percentiles, with fifty as the median percentile. Piano students scored significantly above average on the test, which included reading, language, math, science, social studies, and reference skills.
Grade Score
1 2.1
2 3.4
3 4.7
4 5.8
5 7.1
6 8.0
7 9.0
8 9.7
10 11.7
12 70th percentile
Teachers and Parents
Advanced degrees: 25-30% Master’s.
Student-teacher ratio: 18.7 to one.
Parental involvement: PTA figures were unavailable, but there were approximately 1700 parent volunteers in the schools. School libraries are staffed almost entirely by volunteers, as are the art programs.
And Otherwise
Piano is an affluent, aggressive school district. Its students require extra effort by the school district to challenge them, and they get it. An extensive vocational program of 2- and 3-hour blocks covers a range of careers from auto mechanics to cosmetology to chemistry. Their quarter system allows students more exploratory time by offering short, twelve-week courses. A new Gifted and Talented program caters to the needs of advanced students at early grade levels, utilizing parent volunteers, with topics as advanced as computer language for K-2 children. Piano would be a strong contender for the best school district around.
RICHARDSON
Money
Per pupil expenditure: $1,059. PAR 87.
Taxl Assessment rate: $1.94 at 50%.
Average teacher salary: $11,497; 11.5% over state minimum.
Students
Dropout rate: No figures kept, but an assistant superintendent says the problem is “minimal.”
National Merit finalists: 36.
Higher education rale: 76.8%.
Standardized test scores: Comprehensive Test of Basic Skills, with reading, spelling, language, math, reference skills, science, and social studies subtests. Tests were given to grades 3, 4, 5,6, 7. and 9. Composite percentiles were, respectively, 67, 66, 67, 70, 53, and 56.
Teachers and Parents
Advanced degrees: 54% Master’s.
Student-teacher ratio: 19.3 to one.
Parental involvement: Ratio of enrollment to PTA membership is 1.5 to one. Volunteers work in the libraries, and some assist in the Pacesetter Plan at Hamilton Park Elementary School. The Plan is explained below.
And Otherwise
If the city of Richardson is still growing, the Richardson ISD seems to be positively booming. With a program for virtually every need of its students, the RISD has a complete and comprehensive offering. Special education for the blind, deaf, and every other handicapped group is extensive, even including a homebound instructor for students with long illness. A planetarium, ecological study area, and a successful music program are draws. The unique Pacesetter Plan at Hamilton Park Elementary successfully integrated the all-black school with white volunteers, avoiding the controversy of forced busing. The program has made the school exceptional, with expanded hours of operation, a student-teacher ratio half the normal one, after-school extras, and a high degree of enthusiasm. A weekly arts forum complements the educational fare, and a strong career education division helps prepare students. Richardson is a modern, attentive school district – a good model for the other suburbs to follow.
SUNNYVALE
Money
Per pupil expenditure: $1,692. PAR 140.
Tax/Assessment rate: $1.34 at 50%.
Average teacher salary: $10,536; 9.4% over state minimum.
Students
Sunnyvale does not have a high school; it contracts with the Mesquite ISD for grades 9-12. The first three criteria, then, do not apply. Standardized test scores were not available. They could not be located.
Teachers and Parents
Advanced degrees: 40% Master’s.
Student-teacher ratio: 14.2 to one.
Parental involvement: PTA figures unavailable. Parent volunteers accompany students on nature studies and help raise money for athletics.
And Otherwise
The feeling persists that it is needless red tape and technicalities for this district to exist at all, yet it may be the red tape of a larger district that they are trying to avoid. Facilities are certainly better in next-door Mesquite, and opportunities greater. Still, Sunnyvale’s size does make some activities common that are impractical in larger districts. Special field trips for a variety of topics are common, including an annual weekend trek to Trinidad, at the southern tip of Cedar Creek Reservoir. A law enforcement presentation each year includes officers from the local police, sheriff’s office, Department of Public Safety, FBI, and even the Secret Service.
WILMER-HUTCHINS
Money
Per pupil expenditure: $1,036. PAR 85.
Tax/ Assessment rate: $1.14 at 100%.
Average teacher salary: $11,153:7.4% above state minimum.
Students
Wilmer-Hutchins Superintendent David Cole did not respond to D Magazine’s questions.
Teachers and Parents
Student-teacher ratio: Taken from a Texas Research League report, it’s 19.4 to one. The district provided no information.
And Otherwise
It’s not very big, it’s not very rich, and it sureisn’t very talkative.
Related Articles

D Home Events
Scenes from the D Home Spring Issue Party 2024
The interiors community gathered at the Dallas Market Center on April 3 for the D Home Spring Issue Party.
Arts & Entertainment
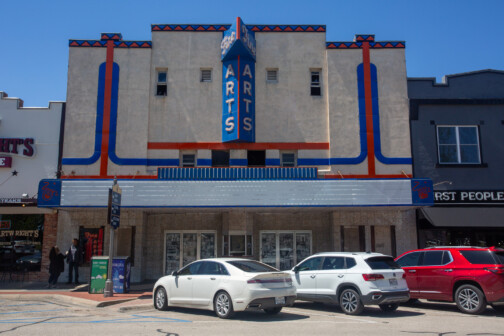
In Denton, New Life for an Old Theater
The entrepreneurs who brought the Texas Theatre back to life in Oak Cliff see a similar future for the Fine Arts in downtown Denton. So does its City Council.

Golf
A New Way to Golf
The game has exploded out of the buttoned-up confines of the country club to become more popular than ever—driven by North Texas’ courses, clubs, innovators, and influencers.