

Due in part to the oil slump, median paychecks for CEOs at Dallas-Fort Worth midsize companies rose only modestly last year. That’s a key finding of D CEO’s seventh annual report on executive compensation at North Texas middle market companies, a powerful cohort in the local economy. As in previous years, research for the study was performed by Paradox Compensation Advisors, a Dallas-based consulting firm.
Paradox analyzed data including revenue, net income, and total compensation (base salary, annual bonuses, and long-term incentives such as stock options and stock awards) for 47 DFW companies with 2015 revenue of $100 million to $1.5 billion. To be included in the study, the company’s CEO had to be in place for the full year (or at least have sufficient information provided to project full-year pay).
Although most would expect the chief executive’s compensation to mirror the company’s performance, that was not the case in 2015. In our study last year of 2014 data, we reported that midsize companies had averaged a 7 percent increase in revenue and a 31 percent increase in net income, correlating to a 15 percent rise in total executive compensation. In 2015, however, revenue increased again by 7 percent but median net income plunged by 6 percent, while total executive compensation stayed basically flat (up 2 percent at the median).
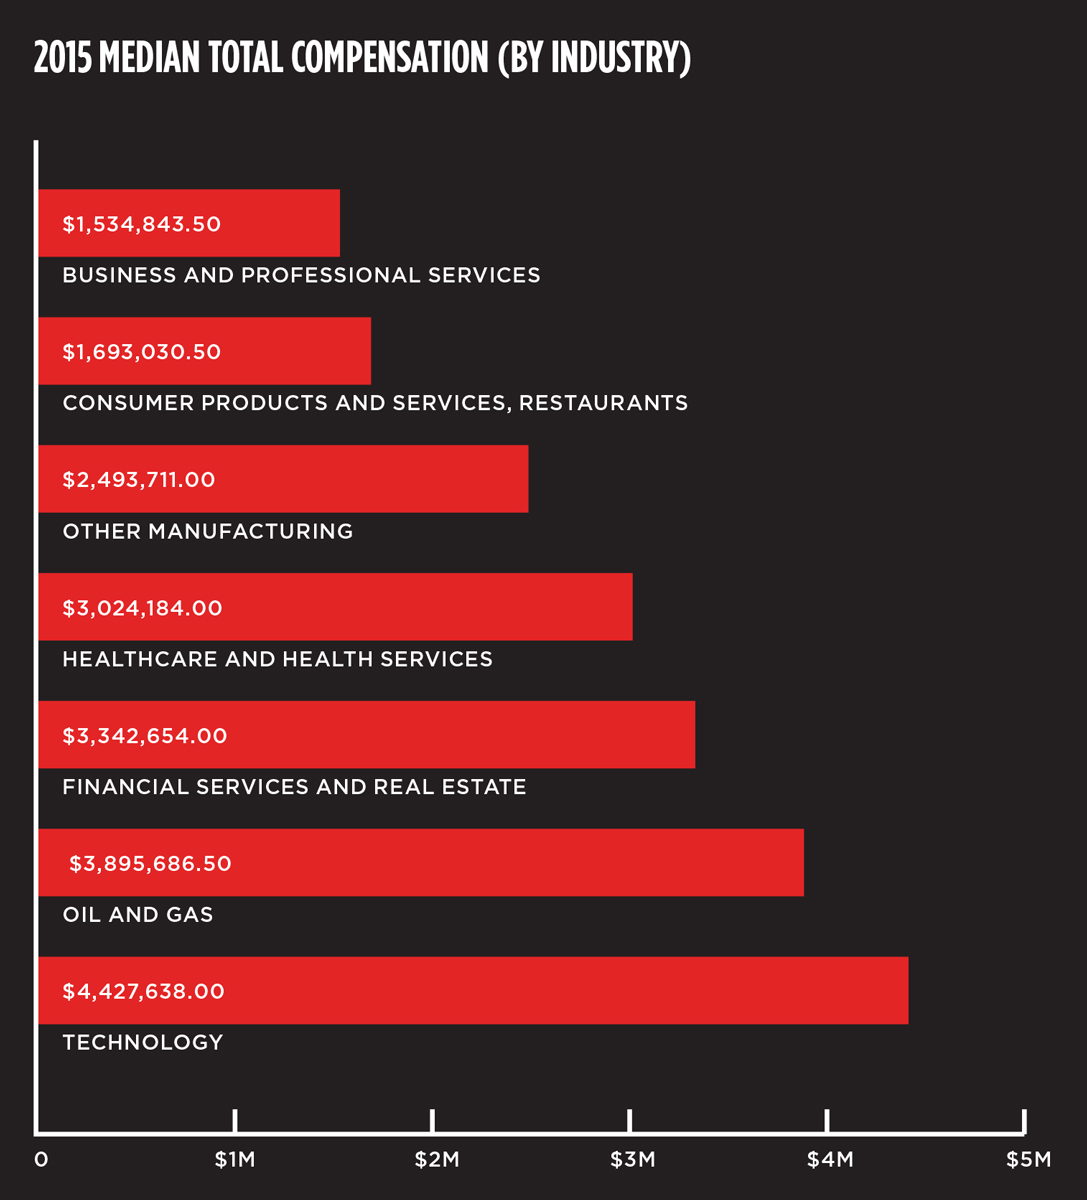
Given the relative strength of the local economy, such results at first blush don’t seem logical. The explanation is simple, though: disastrous performance among oil and gas and oil services companies. Without these companies in the mix, revenue increased 8.6 percent and net income increased by 3 percent. The six oil and gas companies, by contrast, had decreases of approximately 47 percent in revenue and 900 percent in net income.
The impact on CEO pay was widely disparate, with three of the energy companies showing substantial increases in total direct compensation, and three showing decreases (the median was +6.5 percent). Says Marsha Cameron, Paradox senior partner: “Where net income declined and compensation increased, an organization typically has incentive measures that are less related to profitability.”
Meanwhile, CEO base salaries in 2015 grew by 3 percent, the same as for broad-based employees. Both annual bonuses and long-term incentives were flat year over year. As the data on the following pages shows, total 2015 compensation for midsize company CEOs, top to bottom, ranged from $10.8 million for Moneygram International’s Pamela Patsley to $530,000 for Alfredo Bala at Mannatech.
Top 10 CEO Compensation
Dallas Midsize Companies
| Rank 2015 | Company Name | Executive Name | Reported Salary | Total Short Term Incentives | Total Long Term Incentives | Total Reported Compensation 2015 |
|---|---|---|---|---|---|---|
| 1 | MONEYGRAM INTERNATIONAL INC. | Pamela H. Patsley | $925,000 | $4,386,900 | $5,550,016 | $10,861,916 |
| 2 | SIX FLAGS ENTERTAINMENT CORP. | James Reid-Anderson | $1,546,154 | $3,232,800 | $3,129,604 | $7,908,558 |
| 3 | DENBURY RESOURCES INC. | Phil Rykhoek | $780,000 | $697,500 | $4,008,463 | $5,485,963 |
| 4 | EAGLE MATERIALS INC. | Steven R. Rowley | $912,000 | $1,429,216 | $3,000,000 | $5,341,216 |
| 5 | MATADOR RESOURCES CO. | Joseph Wm. Foran | $800,000 | $1,830,000 | $2,647,102 | $5,277,102 |
| 6 | REALPAGE INC. | Stephen T. Winn | $500,000 | $521,076 | $3,953,250 | $4,974,326 |
| 7 | WESTWOOD HOLDINGS GROUP INC. | Brian O. Casey | $600,000 | $2,065,669 | $2,090,200 | $4,755,869 |
| 8 | HOWARD HUGHES CORP. | David R. Weinreb | $1,000,000 | $3,750,000 | $0 | $4,750,000 |
| 9 | RSP PERMIAN INC. | Steven Gray | $600,000 | $810,000 | $2,602,379 | $4,012,379 |
| 10 | FELCOR LODGING TRUST INC. | Richard A. Smith | $787,856 | $733,769 | $2,403,717 | $3,925,342 |
| 11 | CAPITAL SENIOR LIVING CORP. | Lawrence A. Cohen | $742,707 | $742,706 | $2,427,000 | $3,912,413 |
| 12 | DIODES INC. | Keh-Shew Lu | $591,750 | $460,000 | $2,829,200 | $3,880,950 |
| 13 | COMSTOCK RESOURCES INC. | M. Jay Allison | $802,000 | $802,000 | $2,174,994 | $3,778,994 |
| 14 | HMS HOLDINGS CORP. | William C. Lucia | $650,000 | $606,385 | $2,274,991 | $3,531,376 |
| 15 | FIRST CASH FINANCIAL SERVICES INC. | Rick L. Wessel | $1,021,760 | $1,021,760 | $1,404,300 | $3,447,820 |
| 16 | TYLER TECHNOLOGIES INC. | John S. Marr Jr. | $512,000 | $614,400 | $2,308,573 | $3,434,973 |
| 17 | DAVE & BUSTER’S ENTERTAINMENT INC. | Stephen M. King | $717,500 | $1,271,824 | $1,418,212 | $3,407,536 |
| 18 | CAPSTEAD MORTGAGE CORP. | Andrew F. Jacobs | $773,000 | $1,578,911 | $1,031,093 | $3,383,004 |
| 19 | CYRUSONE INC. | Gary J. Wojtaszek | $618,000 | $1,099,654 | $1,625,000 | $3,342,654 |
| 20 | KMG CHEMICALS INC. | Christopher T. Fraser | $660,336 | $816,500 | $1,809,562 | $3,286,398 |
| 21 | US CONCRETE | William Sandbrook | $816,788 | $904,200 | $1,531,823 | $3,252,811 |
| 22 | BASIC ENERGY SERVICES INC. | T.M. Roe Patterson | $665,000 | $0 | $2,541,662 | $3,206,662 |
| 23 | ADEPTUS HEALTH INC. | Thomas S. Hall | $614,054 | $1,236,000 | $1,200,000 | $3,050,054 |
| 24 | GREATBATCH INC. | Thomas J. Hook | $719,192 | $0 | $2,279,122 | $2,998,314 |
| 25 | ENNIS INC. | Keith S. Walters | $915,970 | $995,570 | $759,795 | $2,671,335 |
| 26 | APPROACH RESOURCES INC. | J. Ross Craft | $560,000 | $350,000 | $1,713,661 | $2,623,661 |
| 27 | TUESDAY MORNING CORP. | R. Michael Rouleau | $676,667 | $385,000 | $1,430,805 | $2,492,472 |
| 28 | AZZ INC. | Thomas E. Ferguson | $690,000 | $726,087 | $900,000 | $2,316,087 |
| 29 | CLUBCORP HOLDINGS INC. | Eric L. Affeldt | $650,000 | $416,000 | $1,175,693 | $2,241,693 |
| 30 | TEXAS CAPITAL BANCSHARES INC. | C. Keith Cargill | $729,167 | $425,000 | $864,854 | $2,019,021 |
| 31 | PFSWEB INC. | Michael C. Willoughby | $461,358 | $0 | $1,540,316 | $2,001,674 |
| 32 | A. H. BELO CORP. | James M. Moroney | $600,000 | $699,512 | $487,493 | $1,787,005 |
| 33 | GREEN BRICK PARTNERS INC. | James R. Brickman | $1,400,000 | $350,000 | $0 | $1,750,000 |
| 34 | FIESTA RESTAURANT GROUP INC. | Timothy P. Taft | $550,000 | $99,000 | $950,056 | $1,599,056 |
| 35 | U S LIME & MINERALS | Timothy W. Byrne | $410,000 | $499,963 | $656,730 | $1,566,693 |
| 36 | ATRION CORP. | David A. Battat | $620,000 | $900,000 | $0 | $1,520,000 |
| 37 | NL INDUSTRIES | Robert D. Graham | $1,483,700 | $0 | $11,040 | $1,494,740 |
| 38 | ZOE’S KITCHEN INC. | Kevin Miles | $476,924 | $319,539 | $540,800 | $1,337,263 |
| 39 | INDEPENDENT BANK GROUP INC. | David R. Brooks | $650,000 | $335,000 | $340,095 | $1,325,095 |
| 40 | FARMERS BROS CO. | Michael H. Keown | $500,231 | $125,365 | $507,184 | $1,132,780 |
| 41 | COMPX INTERNATIONAL INC. | David A. Bowers | $518,013 | $550,000 | $0 | $1,068,013 |
| 42 | HALLMARK FINANCIAL SERVICES | Naveen Anand | $500,000 | $250,000 | $291,342 | $1,041,342 |
| 43 | DEL FRISCOS RESTAURANT GROUP INC. | Mark S. Mednansky | $484,615 | $0 | $500,000 | $984,615 |
| 44 | TRIUMPH BANCORP INC. | Aaron P. Graft | $385,000 | $385,000 | $89,290 | $859,290 |
| 45 | KRONOS WORLDWIDE INC. | Bobby D. O’Brien | $678,600 | $0 | $12,560 | $691,160 |
| 46 | CAMBIUM LEARNING GROUP INC. | John Campbell | $389,615 | $287,560 | $0 | $677,175 |
| 47 | MANNATECH INC. | Alfredo Bala | $350,308 | $181,000 | $0 | $531,308 |