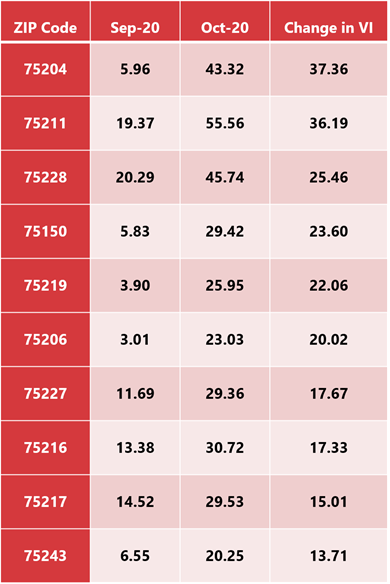
Between late September and late October, ZIP code 75204 became more than 700 percent more vulnerable to COVID-19, according to the Parkland Center for Clinical Innovation. It is one of several areas experiencing significant growth in PCCI’s vulnerability index as the disease continues to spread around the city; the nonprofit has spent the pandemic charting the virus’ prevalence throughout Dallas.
The area includes Old East Dallas, Uptown, and parts of Oak Lawn and it experienced the largest increase in vulnerability from September to October. Although, 75228 (east of Ferguson Road) and 75211 (the Cockrell Hill area) remain more vulnerable overall. The index measures comorbidity rates with chronic illnesses like hypertension, cancer, diabetes, heart disease, areas with high density of populations over the age of 65, and increased social deprivation such as lack of access to food, medicine, employment, and transportation. These factors are combined with existing COVID-19 rates and mobility to come up with an index.
The Far East Dallas ZIP code of 75228 was the sixth most vulnerable in September but is now the second highest in Dallas County. Increased mobility and rising COVID-19 infections were the leading causes of vulnerability increases. School openings have also been a factor, says Steve Miff, the CEO of PCCI. The index is based on Dallas County’s peak COVID-19 levels in July, which would be scored 100 on the vulnerability index. That means most areas are well below where they were this summer, which is why the increases are so alarming.
Data like this are used to educate patients and providers to establish how vulnerable they might be in some areas of town, resulting in moving an appointment from in-person to virtual or initiating proactive outreach efforts to those who might be more at risk. The data and outreach are important for two reasons, Miff says. “One is to make sure they have access to their medications, and the other is to see if they have any food insecurity. Then we are able to connect those individuals to the right services.”
The data can warn people about the flu, as the factors that make a person more vulnerable to COVID-19 also mean they are more susceptible to flu. This helps community clinics to arm themselves with enough flu shots and to prepare for an influx of patients. The index also helps educate health system leaders.
“We continue to run a forecasting model for the capacity to make sure that we give the leadership team visibility to what’s coming next,” Miff says.
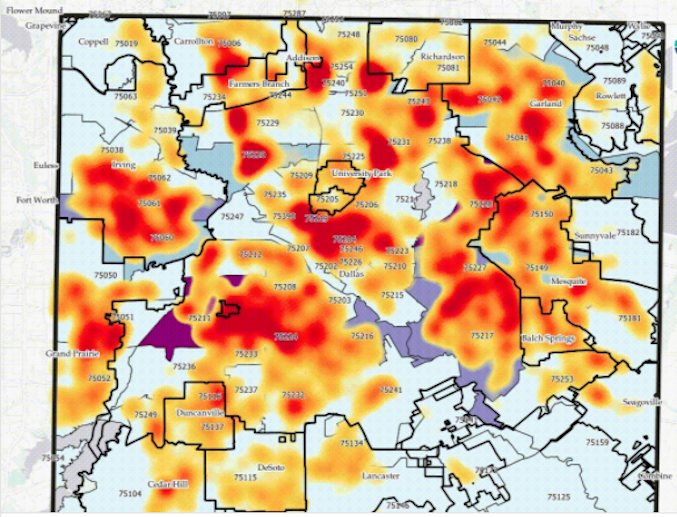
PCCI also created a map to show how COVID-19 hot spots have correlated with vulnerable areas. During the pandemic, the vulnerability of an area and COVID-19 cases have lined up, though there have been instances when less vulnerable areas experienced high numbers of COVID cases. In late August and early September, the Park Cities saw an influx of cases, which may have been due to holiday travel.
Visualizing the data and understanding the risks will be essential if there is hope for bringing COVID-19 cases under control. Texas has the most COVID-19 cases in the country, and Dallas is reporting between 700 and 800 new cases daily. Statewide, more than 9,000 cases were reported in a single day this week, the highest total since early August. “Our daily numbers continue to climb as do our hospitalizations, and it’s more important now than ever that we wear our mask and avoid crowds,” Dallas County Judge Clay Jenkins tweeted this week. “We know what to do, we just need to do it. We cannot afford to go into the holiday season with an all-time high of daily #COVID19 cases.”
See how the cases grew and shrunk over time overlaid with the vulnerability of a ZIP code below.
At PCCI, the team found that an individual who was in a vulnerable area was seven times more likely to contract the disease than someone who wasn’t. The hope is to get information like this into the hands of providers and community members to help them make behavior adjustments.
“We want an individual that family to log in securely, enter their address, and then be given where the cases are progressing across the community,” Miff says. “Using the machine learning algorithm to calculate a proximity risk score for their family, so they’re contextually aware of what’s happening.”
Since early in the pandemic, PCCI has been mapping different aspects of the pandemic to educate and improve outcomes.
“We built the vulnerability index to save lives and to provide actionable intelligence to the community, health officials, civic leaders, and school leaders,” says Thomas Roderick, a senior data and applied scientist at PCCI. “But it’s ultimately to help save lives, and we feel that is a great contribution that PCCI can provide the community.”