
If you’ve read any articles about the proposed bond program on the ballot this November, you have undoubtedly read a quote or two from School Board Trustee Joyce Foreman. She has been very vocal in her opposition to the bond, and she always gets quoted. This is because the media want to “cover both sides” of the issue, and she is the most vocal opponent of the DISD bond.
Actually, that’s not accurate: Joyce Foreman is the ONLY vocal opponent to the DISD bond, at least among elected officials in Dallas.
This sort of reporting – “… but opponents disagree [quotes only vocal opponent]” – is often called false equivalence, but it’s really false balance. It suggests there are a fairly equal number of proponents and opponents on either end of the perfectly weighted seesaw. This is not true. Again, we have Foreman high in the air on one end, alone, yelling at the entire city on the other end.
What we’re lacking is an examination of just why she is all alone, howling at imaginary demons. Perhaps she is a Looper who has traveled back in time to warn us of that which we cannot know. I think, though, she is what she appears to be: someone willing to lie to derail any positive reform in DISD, so that she can maintain her status as some sort of brave populist and continue to win elections in a broken governance system that we’re too cowardly to fix.
Let’s do some fact-checking to see if I’m right.
From Facebook, posted Sept 28:
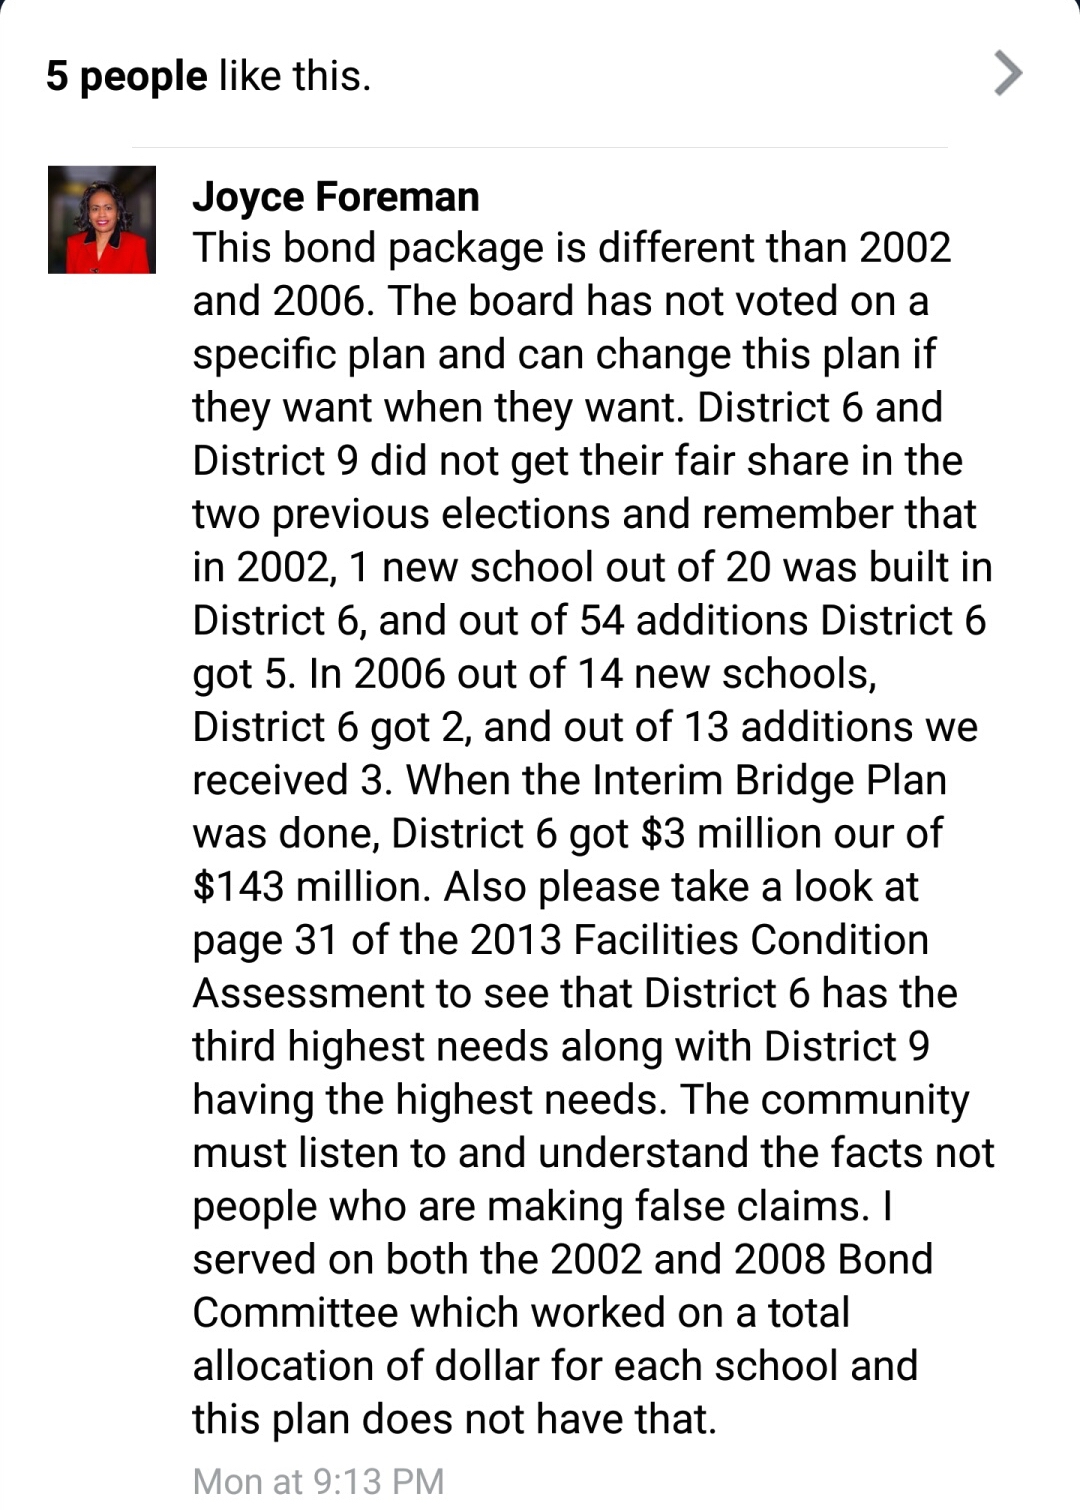
She makes a lot of claims. Let me break them down like an organic compound:
Claim No. 1:
“This bond package is different than 2002 and 200[8]. The board has not voted on a specific plan and can change this plan if they want when they want.”
First, a quick note to Ms Foreman: You are “they.” As I recall, you were elected to the board. I suppose it helps a politician to keep complaining about “they.” But you are, in fact, “them.”
As to the claims: Here’s a PDF of the board agenda and resolution authorizing the 2008 bond election. Here’s a link to the board resolution from August 21 authorizing the current bond election. The language is nearly identical, and both work the same way: Voters are authorizing the board to borrow money. Nowhere in either resolution has the board voted to approve a specific plan. Moreover, even if the current board did break with tradition and vote to approve a specific plan, democracy doesn’t work the way Foreman implies. Future boards are always allowed to change decisions. That’s why we have elections. That’s why we have phrases like “the price of freedom is eternal vigilance.”
Verdict: FALSE
Claim No. 2:
“District 6 and District 9 did not get their fair share in the two previous elections…”
The district has provided a handy summary map showing total spending by trustee district for the last two bond programs:
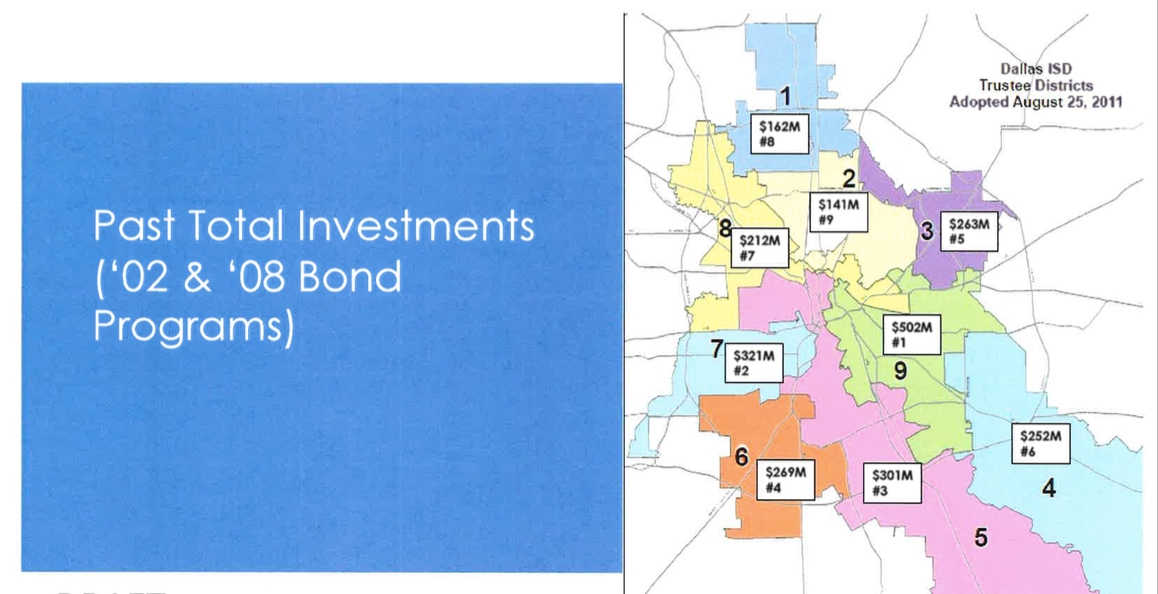
District 9 is first in total spending at $502M. That is actually more than triple the amount spent in the northern District 2. District 6 is fourth in total spending at $256M. That is almost $100M more than spent in the far northern District 1.
I’m not sure what standard Ms Foreman uses in her definition of fair. It would seem logical to include counts of children. District 9 has the most kids, so it would seem natural that they get the most money. District 2 has the fewest kids, so it would seem natural that they get the least money. But the difference in enrollment count between those two districts is only about double. (Currently, D9 has about 24,300 kids, D2 has about 11,400). So, three-to-one spending vs two-to-one enrollment implies a funding victory for D9.
You’d have to look at the condition of facilities and the degree of overcrowding to really make an accurate judgment on fairness. But it’s fairly absurd to suggest that the past two bond programs have been unfair to D6 and D9 given their high allocations.
In addition, here’s a numeric breakdown (from a pic of a slide, sorry) from the 2008 bond program where it’s clear that D9 in particular, and D6 as well, get their fair share.

Verdict: FALSE
Claim No. 3:
“Remember that in 2002, 1 new school out of 20 was built in District 6, and out of 54 additions District 6 got 5. In 200[8], out of 14 new schools, District 6 got 2, and out of 13 additions we received 3.”
We finally get to an attempt at an accurate statement. In terms of total projects, she ignores four rebuilt schools that were effectively new from the 2008 program in her counts, and she ignores two extra additions as well. Oh yeah, four of these additions were in District 6, not three as she states. Beyond those problems, the other District 6 counts are all essentially correct facts. Today. They weren’t correct from 2008 to 2011. That is because two new and repurposed schools built by DISD were previously in District 6, but during redistricting in 2011 they were drawn into District 5. So when the 2008 bond was planned, four new schools out 18 were in District 6. There are 9 Districts, so a totally equal allocation would be 11.1 percent. I don’t know about you, but I’m not sure six new schools in a decade, fully 15.8 percent of all new schools built, is some grand injustice.
In any event, it makes a lot more sense to look at the current plan, factoring facility conditions and capacity problems with a view toward educational needs, rather than get all up in arms over some perceived past allotment.
But maybe all we want to do is get angry about something. So how about we get angry over the trustee district that has truly gotten the shaft in the last two bond programs. Consider this alternative statement:
“Remember that in 2002, zero new schools out of 20 were built in District 2, and out of 54 additions, District 2 got seven. In 2008, out of 18 new schools, District 2 got zero, and out of 15 additions, we received one.”
Quick summary: D6 = 14 major projects, D2 = 8 major projects. District 2 is WAY worse than District 6. Why isn’t the trustee from District 2 all up in arms and opposed to the current bond given this past injustice? Possibly because that Mike Morath realizes that a trustee is supposed to represent all the children of DISD, and isn’t supposed to pit some kids against others. Or possibly because these arbitrary facts are way out of context in terms of the overall needs of DISD.
Verdict: 50 percent OF STATS FALSE, VERY MISLEADING
Claim No. 4:
“When the Interim Bridge Plan was done, District 6 got $3 million ou[t] of $143 million.”
This is the most accurate statement yet, even though she rounded down from $3.2 million. And the total is $134.8 million. But pretty close. You can verify it yourself by viewing the Interim Bridge Plan document here.
I should first note that this Interim Bridge Plan is subject to change by “them,” the board, if they want, when they want. Just like every bond program ever done in DISD.
Second, shouldn’t someone charged with representing the interest of the taxpayer be more concerned with prioritizing needs for DISD rather than bringing home the bacon? I’m sure that DISD could build an artificial island on White Rock Lake and then put a school on top of it, which would look great for Districts 2 and 3 in terms of money spent in their backyard. But there aren’t any kids floating in the lake that would go to that school. Perhaps we should be more concerned with addressing real needs.
Third, if all we’re interested in doing is dividing people over relatively arbitrary numbers, how about we focus on the district that actually got the lowest allocation in the Interim Bridge Plan? Cause it wasn’t District 6. Consider this alternative quote:
“When the Interim Bridge Plan was done, District 7 got exactly $3 million out of $135 million.”
Fellow residents of District 7, let’s get our torches and go after all “those” people in the other districts! For we, District 7 residents, were actually shorted the MOST!
Verdict: SOMEWHAT TRUTHY BUT MISLEADING
Claim No. 5:
“Also please take a look at page 31 of the 2013 Facilities Condition Assessment to see that District 6 has the third highest needs along with District 9 having the highest needs.”
Good advice. Let’s do that. It will give us real context on needs. Here’s page 31 of the 2013 Facilities Condition Assessment:
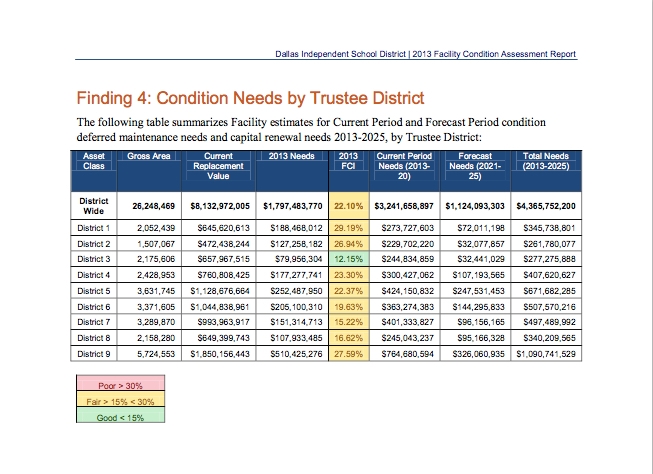
The important number here is the “2013 FCI” column. That tells you the average condition of all the buildings in that portion of the district, without giving more weight to portions of the district that have more buildings than others. Comparing school conditions like this allows for an apples-to-apples comparison school by school, and it highlights areas where schools are in far worse shape than others.
Alternatively, you could rank based on “total needs” (which is what Foreman is trying to highlight). Now, it’s fair for you to think that total dollar needs is relevant, and it is somewhat. But this is about context. For one thing, those total dollars are not just for schools, they’re for administration buildings. D9 has many horrible administration buildings, so that increases the total dollars need but doesn’t get at helping school facilities. Another bit of context: Thinking only about total needs means that if a trustee district was allocated many more construction projects in past bonds, it would always require more to maintain those extra buildings, and should therefore always get more total dollars, even when schools in other parts of the district are in far worse shape. It’s an inherently unfair way to allocate resources to kids sitting in crumbling buildings, which is why the “2013 FCI” column is the most relevant column (and why it’s highlighted in the graph above in the report). Once the FCI is equal across the board at an acceptable number, it might be relevant to simply look at total needs. But right now, according to the more objective priority-ranking system of FCI, schools are in the absolute worst shape in District 1. District 9, which Foreman claims is highest, actually has the second highest needs for repair. So that portion of her claim is a little off.
The third-highest need is in District 2. District 6 is actually ranked sixth out of the nine districts. So, that portion of her claim is way off.
But isn’t this statement only important if the money allocated by trustee district is way different than these rankings? And shouldn’t we factor in the degree of over capacity problems at campuses when allocating money? I’ll skip the capacity analysis for now, since this post is too long already. But I did a bit of math on the amount of money allocated to projects in the bond plan by trustee district. When I do that math (and I could be off), District 9 has about 13 percent of the allocation of all projects in the district, which means it’s getting the second-highest allocation of funds in this bond plan. (District 5, which stretches from Wilmer to West Dallas, is getting the highest).
Verdict: FALSE
Claim No. 6
“I served on both the 2002 and 2008 Bond Committee[s] which worked on a total allocation of dollar[s] for each school and this plan does not have that.”
Here’s a link to a document put together by the district for this plan. It lists projects by campus. With dollar amounts. Here’s another link, which separates out the big projects by campus. And lists dollar amounts.
So, the current bond plan does list the allocation of dollar amounts for each school.
Verdict: FALSE
Claim No. 7:
“The community must listen to and understand the facts not people who are making false claims.”
Verdict: I couldn’t agree more.