In the comments of my last post, local anti-Miles professional Michael MacNaughton tries to catch me in a screw-up. He says the following:
The districts overall ranking in the 2-1 quartile continues a steady improvement as measured by the ERG for the last 5 years. But understand that the ranking is based on the districts combined academic and financial performance. In other words, the district provides a high relative academic performance at the lowest relative cost per student.
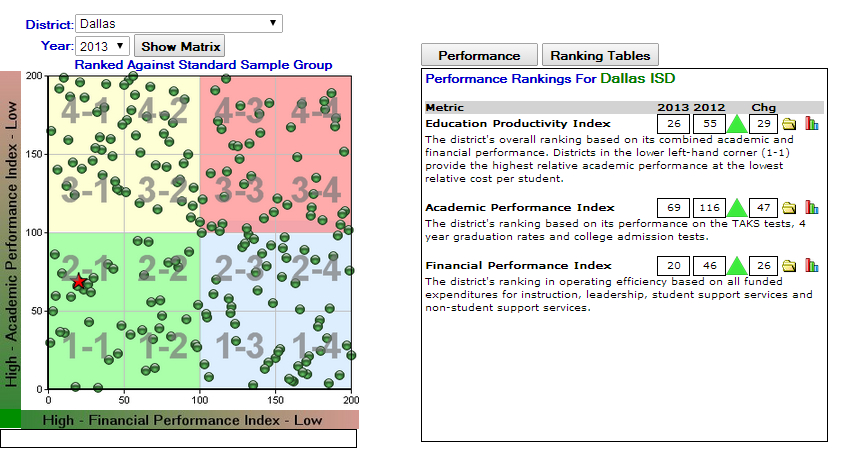
My response is below, but I wanted to point out the charts at the top of the page to drive the point home that a) MM is wrong, and what I was discussing was only an academic performance metric, and that b) if you include ERG’s financial and combined academic-financial performance metrics, the district had an impressive jump in all three. (It’s just that the jump in the other two was not as impressive as in the academic performance measure.)
MM, you’re confusing ERG’s District Productivity Index (which takes both academic and financial performance into account) with the District Performance Index, which only considers the academic performance measurements I describe in the post. (ERG also calculates a District Financial Index, separate from academic performance.) Here’s the webpage that shows the top 10 districts in each performance category to help you keep them separate in your head.
I know you’re not just trying to find damaging information about Mr. Miles, MM, and care only about what the data show. Honest mistake on your part.