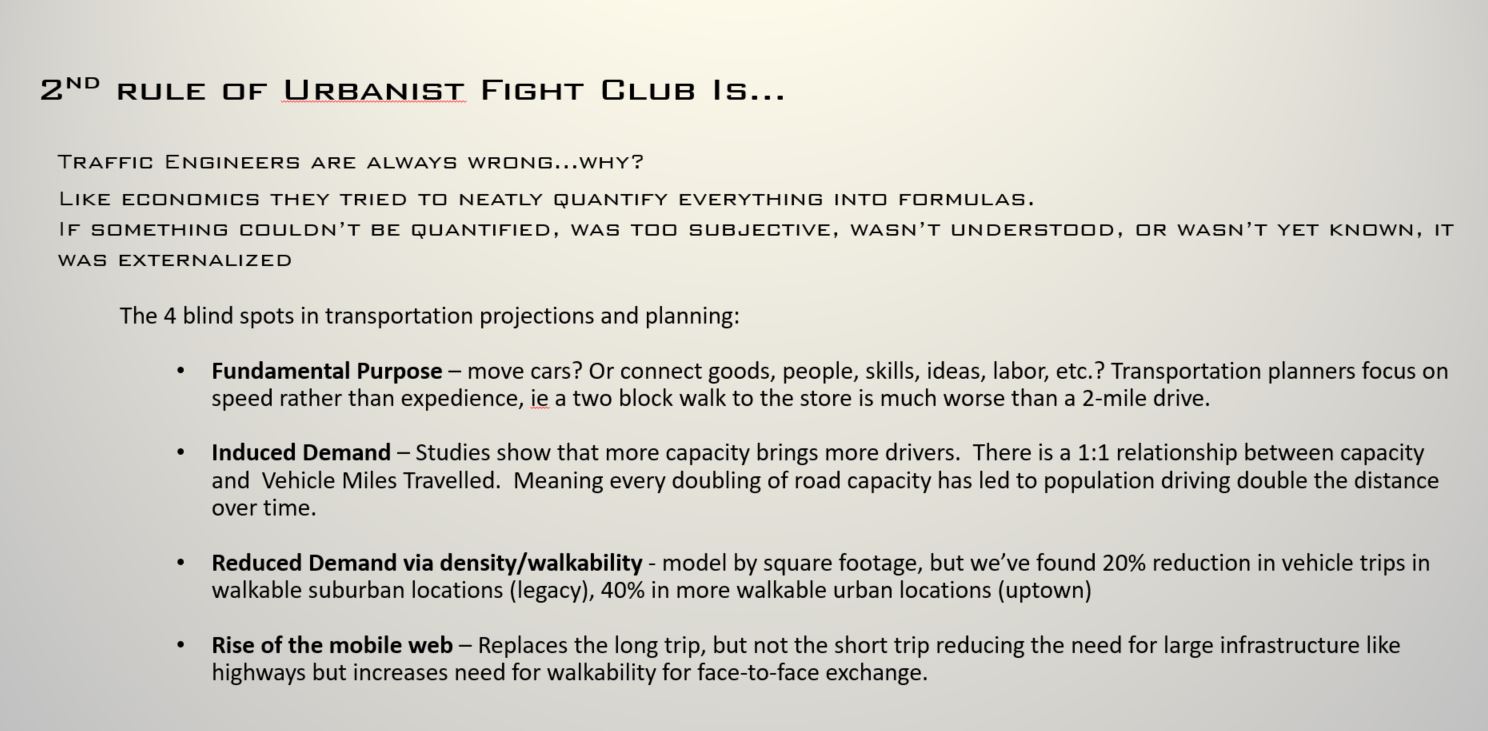
With the kind of time today to actually write a new blog post, I found myself going back through some old presentations from three-, four-, five-years ago when I first began publicly making the case for highway removal and the need for more efficient cities. I wasn’t intending to dust off the ol’ blogging fingers today, a tweet by @USDOT stoked an old flame:
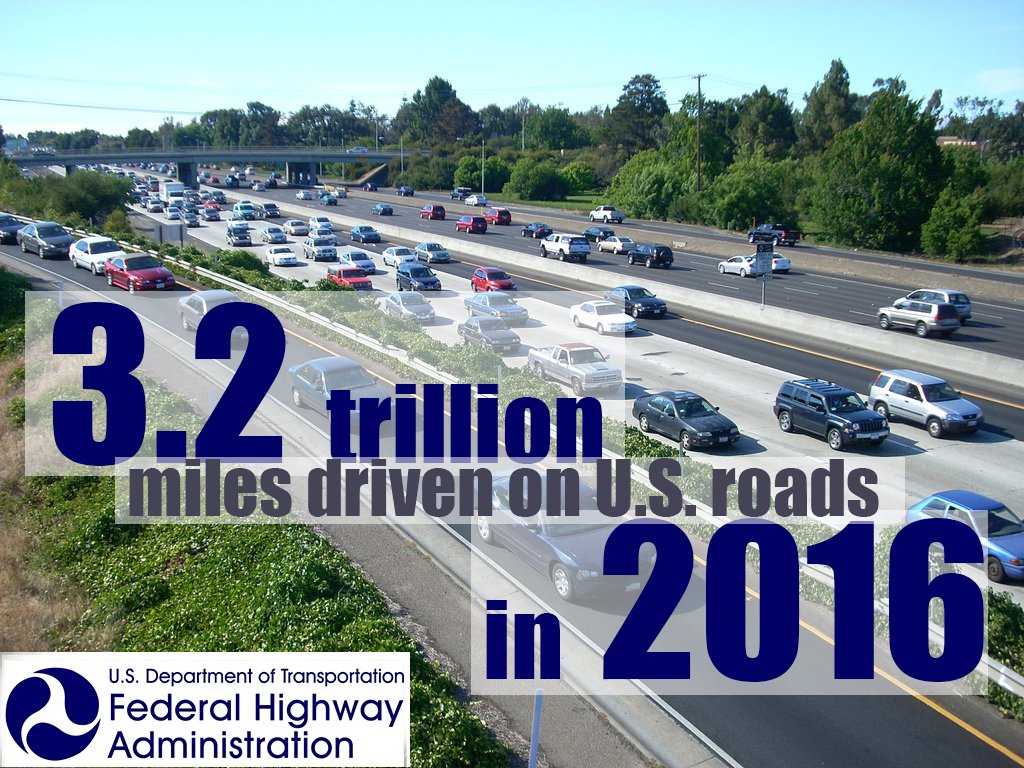
These are the kind of data points that once upon a time drove me to my snarkiest. It’s not the fact that is irritating, but the celebratory tone which opened an old (one might say antiquated) wound. To debunk the sentiment I’ve screengrabbed a handful of slides and graphics from various presentations I’ve given over the years, mostly from 2013 and ’14 which I was browsing to refresh my memory.
A battle I had (wrongly) assumed was over was the notion common amongst traffic engineers of yore (one might say the 20th century or prehistoric) that more VMTs (Vehicle Miles Traveled) was indicative of a stronger economy. And they had charts to prove it:

See! Facts! More driving equals more GDP. Except, GDP on a long enough timeline is generally always proceeding upwards. Furthermore, more population is going to equal more overall driving.
The question is 1) whether there is more driving per capita, and 2) what on earth could that ever have to do with increased GDP besides the increase in gasoline consumption, car purchases, insurance, and of course healthcare to cover the 30,000 people killed and 1 million injured on roads every year.
An accident involving a bus full of school children increases GDP, which should start to raise all sorts of questions about what in fact we’re measuring and why.
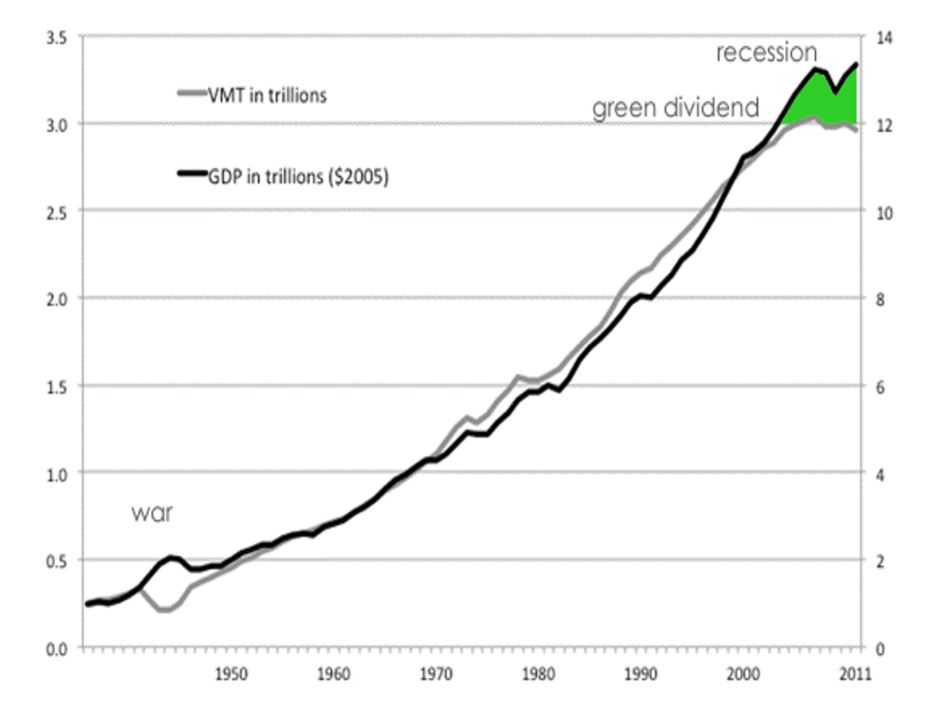
What has happened, is that even though total VMT is rising again, it has generally plateaued since around 2004-5 while GDP has continued to increase despite the downturn from ’07-’09. The gap between these two lines is what I called the “green dividend,” which refers to an increase in economic growth and well-being without an increase in waste, ie driving. I’ll get more into the contrast between waste and trips later.
For now, we have to understand the other weakness in this chart is that it is nationwide. It is not comparing cities. The real variable is the form and function of cities considering all the same types of trips are happening in every city (going to school, work, shopping, etc.). Which are doing so in a more productive way, generating more GDP? And which are doing so in a more efficient way, with less waste (the time, energy, and distance between destinations)?
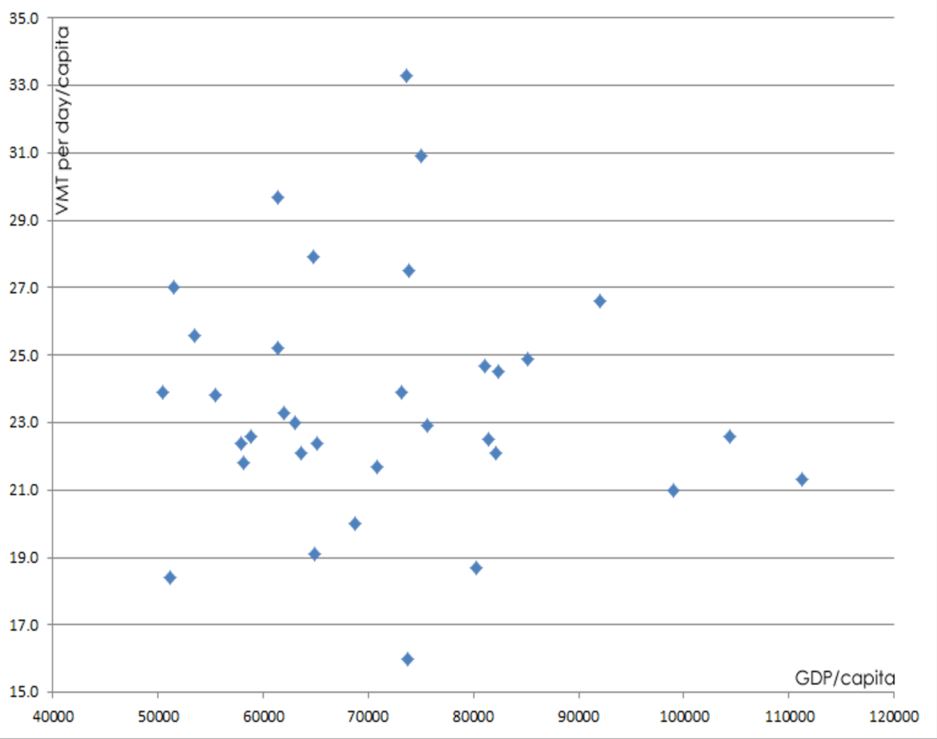
Above is a chart of the 30-35(?) largest metros in the U.S. comparing their GDP per capita to their VMT per capita. If you can find a pattern in there, you win a prize. My point of putting together such a chart was simply to debunk the overly simplistic (and frankly false) notion or goal of more driving as a sign of a stronger economy.
If we were to drill down to compare two extreme ends of the spectrum in order to explore the issue of waste, I looked at Copenhagen and Houston due to the disparity in percentage of trips made by car.
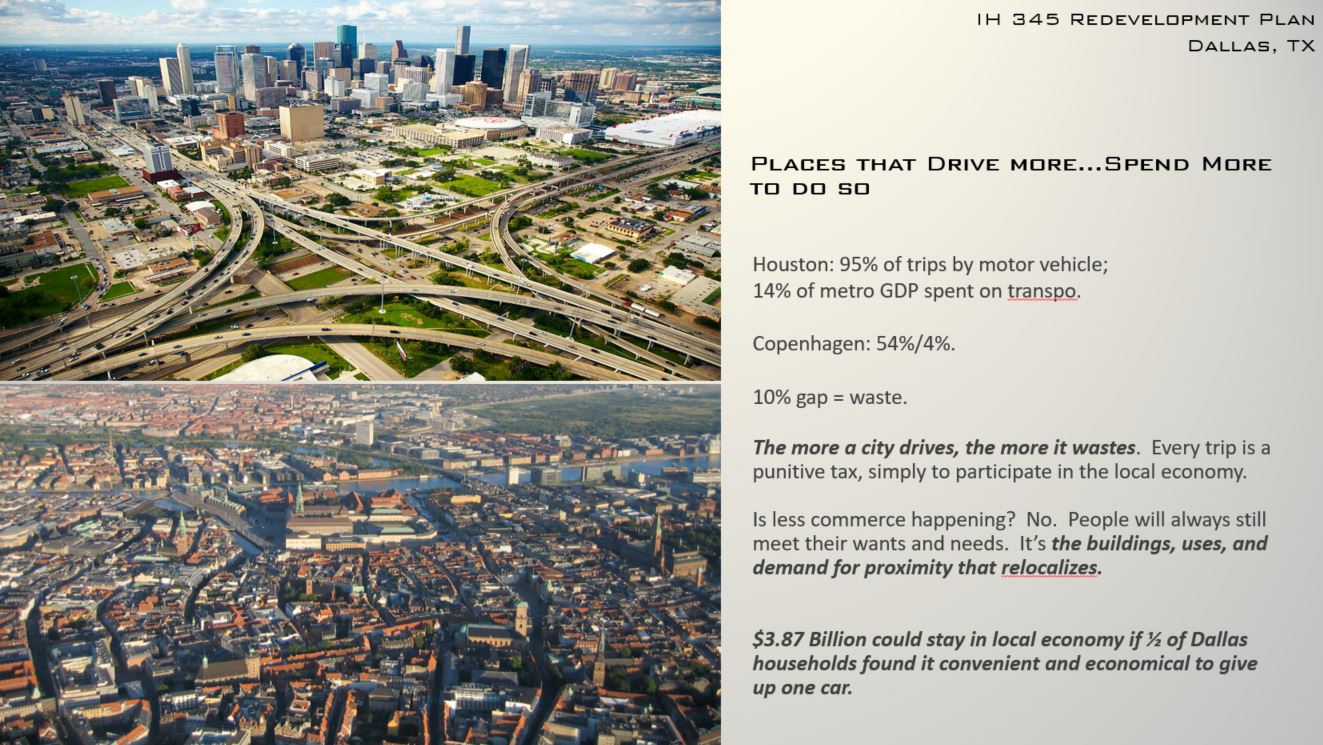
I used these two cities as foils because Houston serves as a reliable proxy for DFW. On the global spectrum of cities, the two are pretty close in behavior patterns. I used Copenhagen of course due to its preeminence as a bike-friendly city since bicycling is the most energy efficient way to make daily trips ever invented. It is however difficult to directly compare these two cities because they’re very different, culturally, spatially, numerically, etc. What they are though are both economically productive (though European cities tend to use GVA rather than GDP).
Instead, what is critical to think about is their similarity as cities for what cities are: the physical market for the exchange of all the things that make us human for a population of a certain size. Can we measure the proficiency and efficiency of a city as a machine for facilitating social and economic exchange?
The key data points that I want to call out are that Houston spends 14% of its metro GDP on transportation. That’s public and private sector spending combined. Meanwhile, Copenhagen spends 4% of its GDP. The first point is that we will never get to zero. Transportation will always have a cost and the infrastructure of cities as a platform for exchange will always be a loss leader. However, that loss leader has to bear a long-term return on investment over the life-span of that infrastructural investment including its on-going annual maintenance. Do our public investments ensure the virtuous circle of tax base exceeding tax burden (the loss leader of infrastructure) so that we are growing the commonwealth and able to reinvest in increased amenity, efficiency, and opportunity?
The second and more important point is that you might consider that gap (14 – 4 = 10%) to be counted as waste in the economy. That is unnecessary time, distance, energy, and capital expended to make the same trips occur. If we can’t achieve 10% greater efficiency, even if we can improve by 1% that is a huge value capture for economies the size of Houston or DFW, meaning as much as $5 billion could remain in the local economy to be spent in any number of better ways.
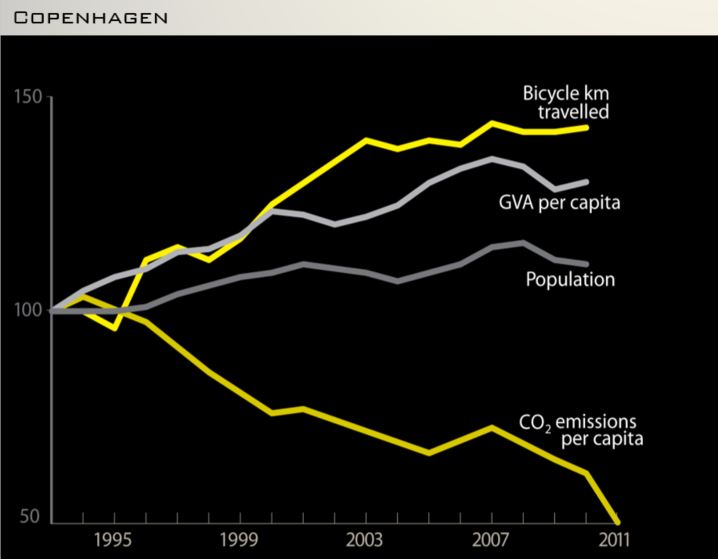
Of course, the third point is that GDP and similar metrics can only include quantifiable dollar figures. What is the value of decreasing CO2 emissions when making those trips? Well, we don’t know now, but we’ll have a better idea when both Houston and Copenhagen become better known as Atlantis 3 and 4 (after Miami, of course). In other words, those subjective or long-term costs get externalized. Anybody with half a brain though would realize the extreme long-term costs of such factors and therefore pollution is yet another form of waste to reduce from the economy. As you can see Copenhagen is working diligently to do:
You care about the things you measure and the things you budget for. Let this be another way of measuring society along with how we treat the least among us.
Of course, this post is about highways and what they do to the complex nature of spatial economics. Not long ago I picked up a book called Access, Property, and American Urban Space (before it reached its current price) that explores the notion of accessibility and connectivity within the configuration of space (the form of cities) and what role spatial configuration has on economies. In the book, M. Gordon Brown makes the case that American Productivity dropped since 1972 due to the severe spatial re-configuration that occurred since highways became the defining aspect of American city form and transportation mode.
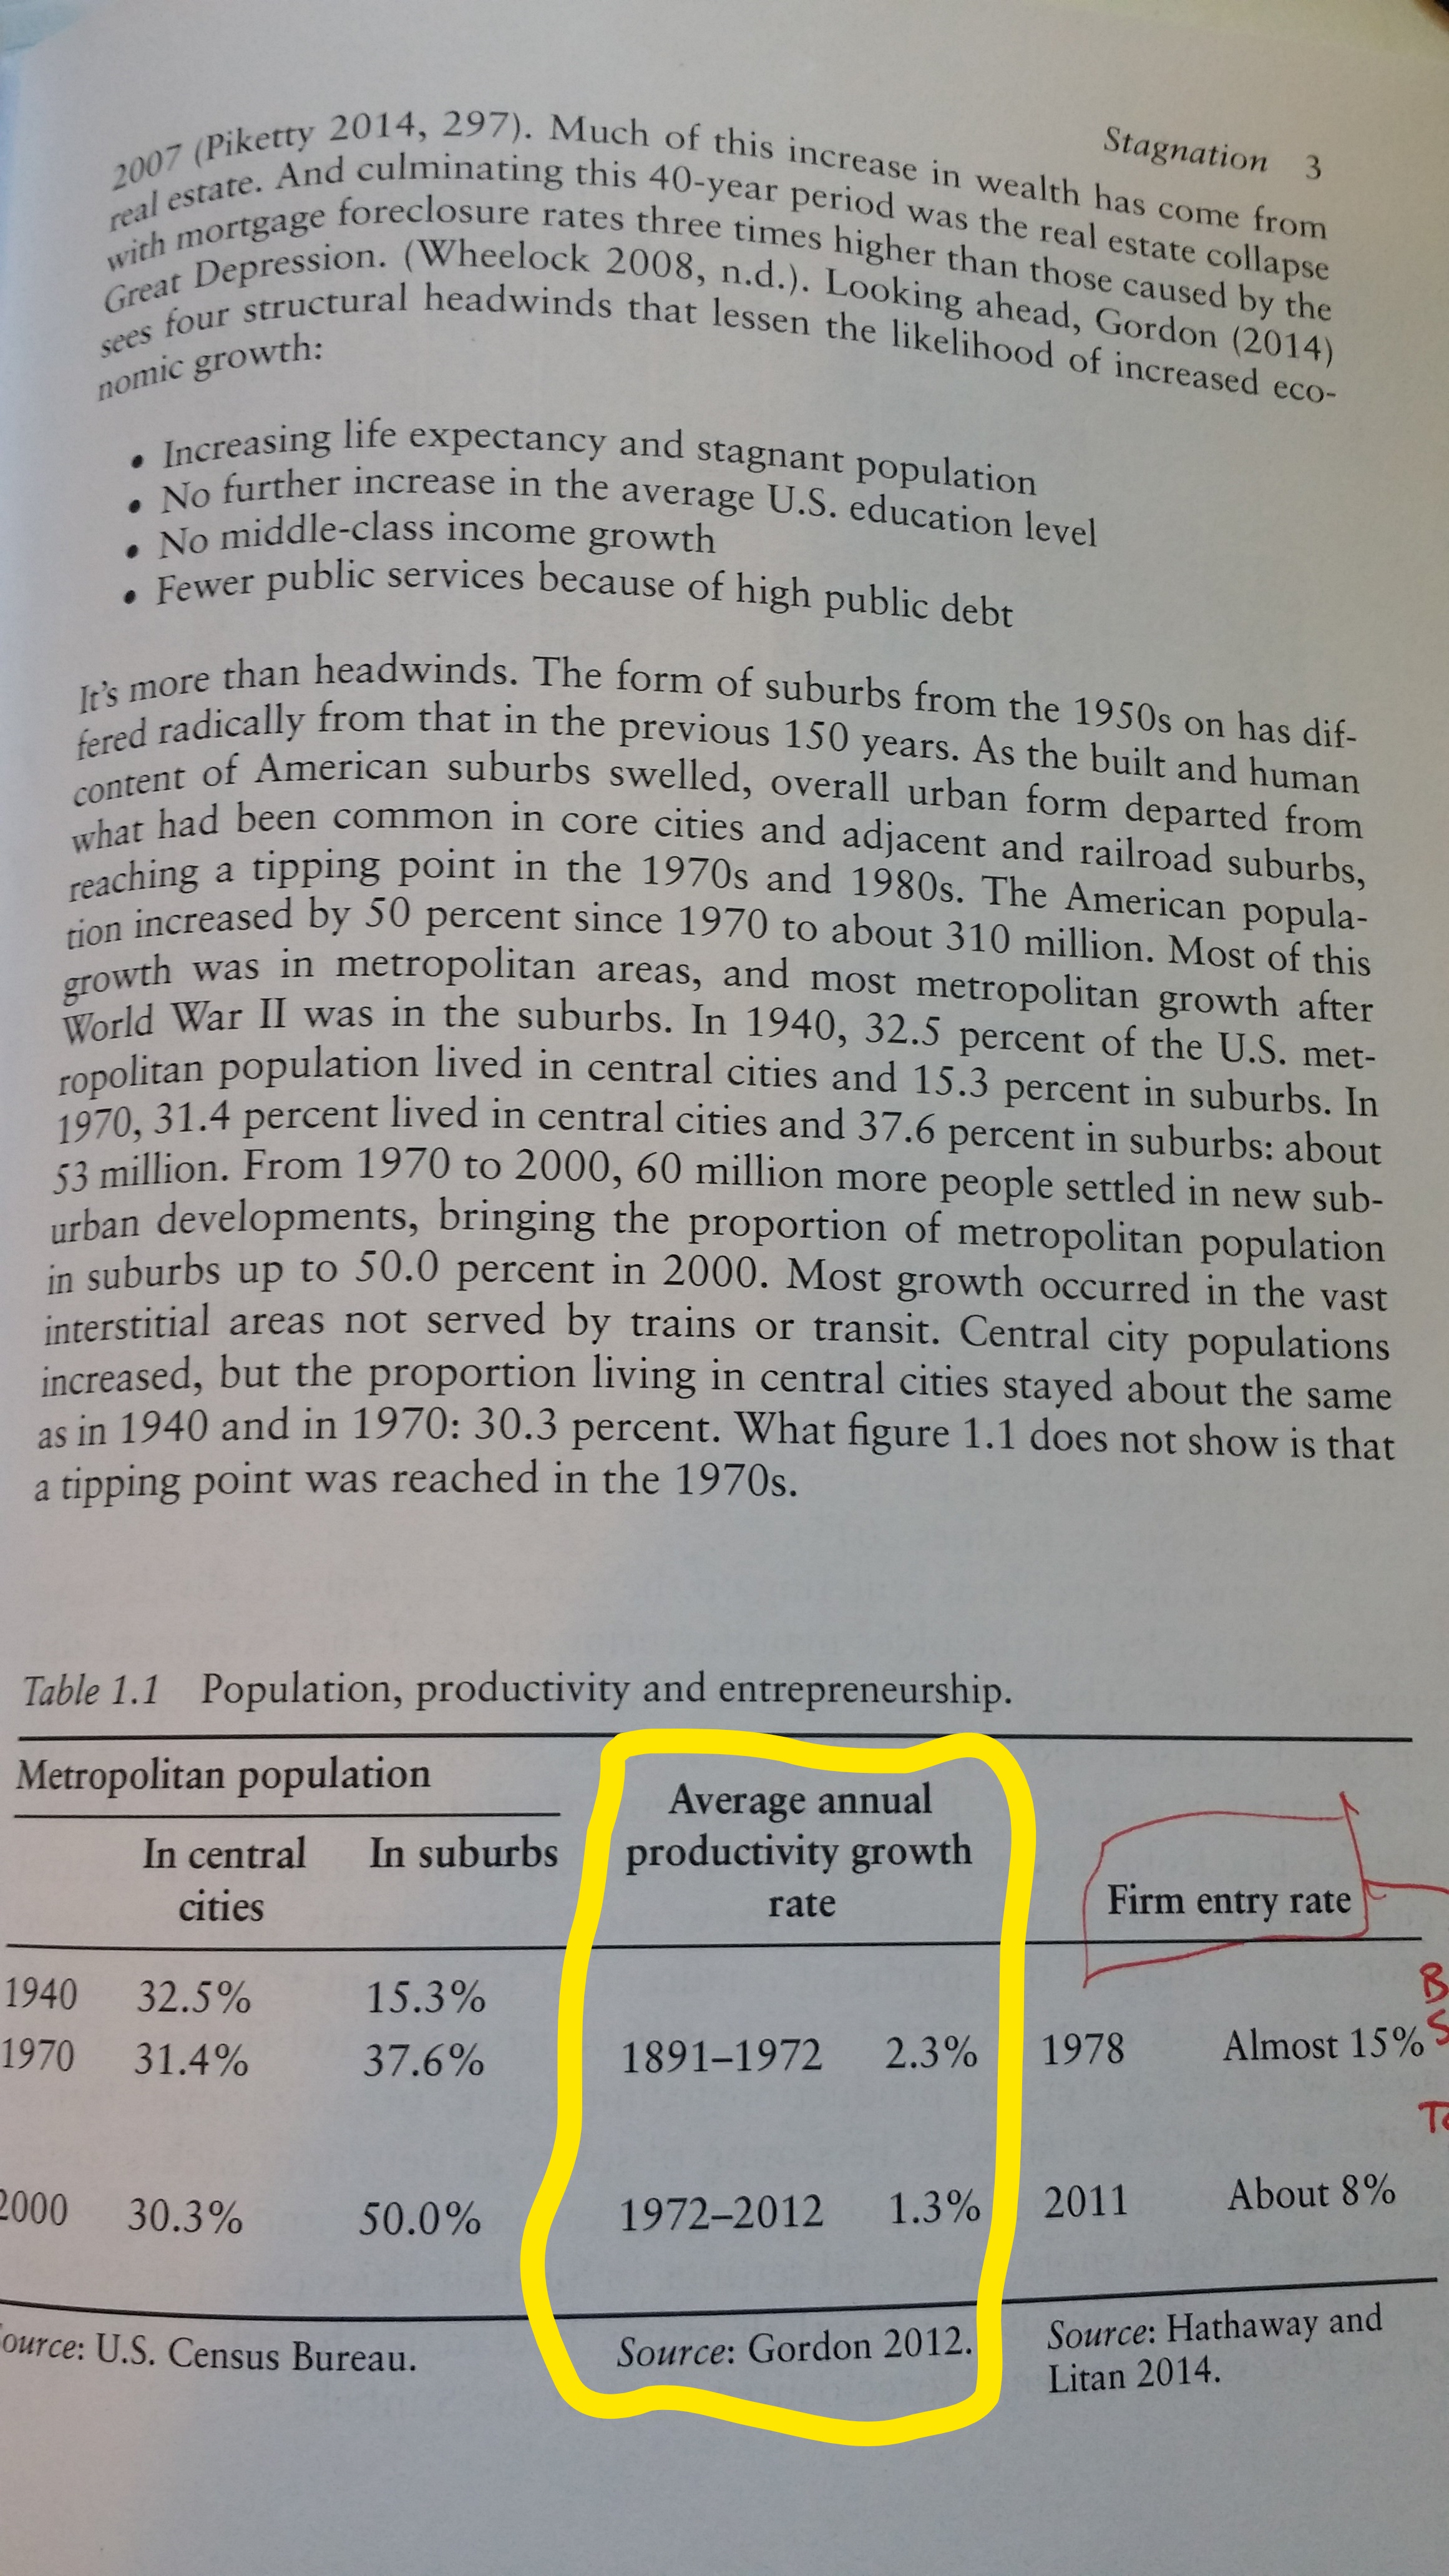
You get what you budget for and we budgeted for a lot of highway lane miles around the country. Because, you know, more driving equals more economic growth or something. Instead, what we’ve been doing is heavily subsidizing less efficient spatial economies which is in turn a drain on both public and private sector coffers.
Speaking of that notion of growth, I decided to look at population growth in Dallas-Fort Worth pre-highway and post-highway since so often highways are claimed to be 1) the reason for DFW growth and/or 2) needed because of that extreme growth. Neither of which are true, of course. Lazy narratives stay lazy.
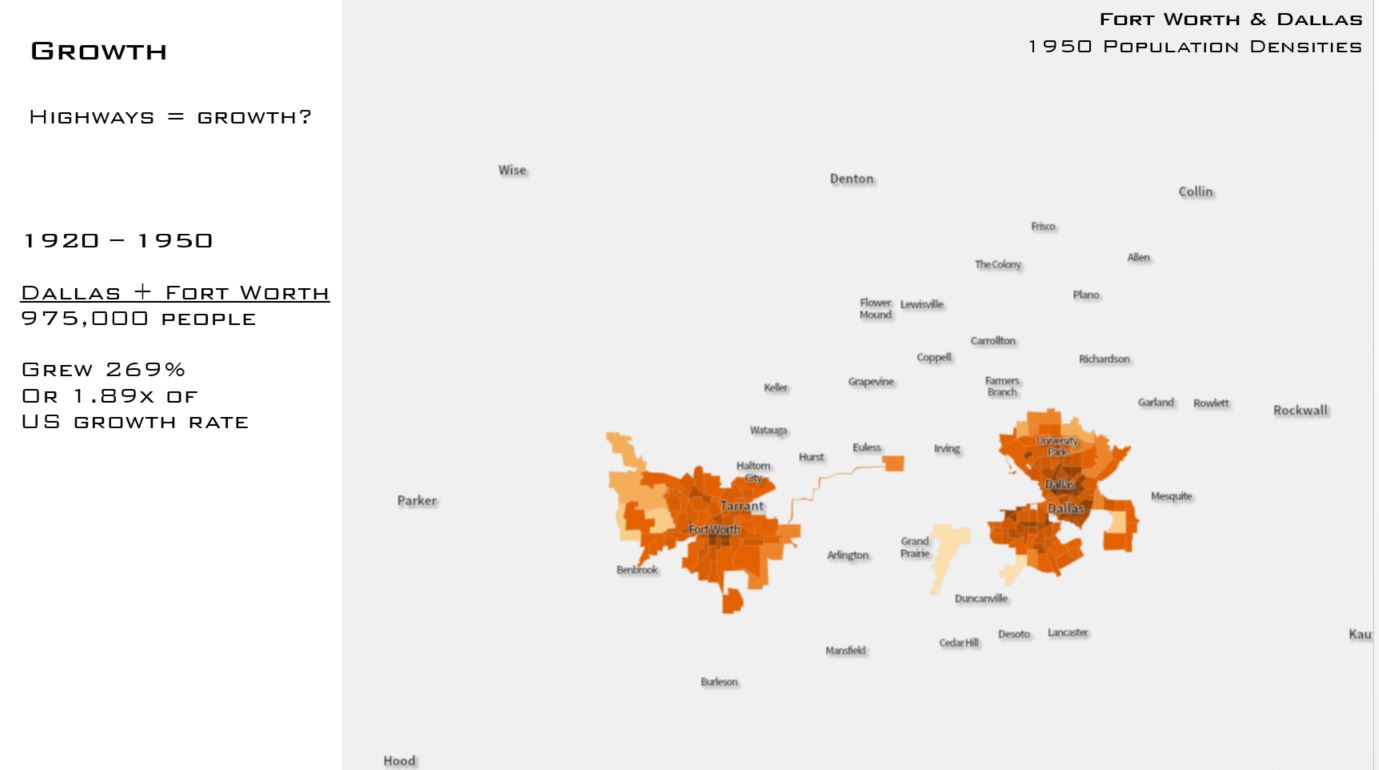
Above is a population density map of Dallas and Fort Worth in 1950 with some data points measuring growth from 1920-1950 (pre-interstate highway system). The area approached 1 million in population, grew at a rate of 269% of those thirty years, which was 1.89x that of the national growth rate (which is mighty impressive considering these were the golden years of the rust belt).
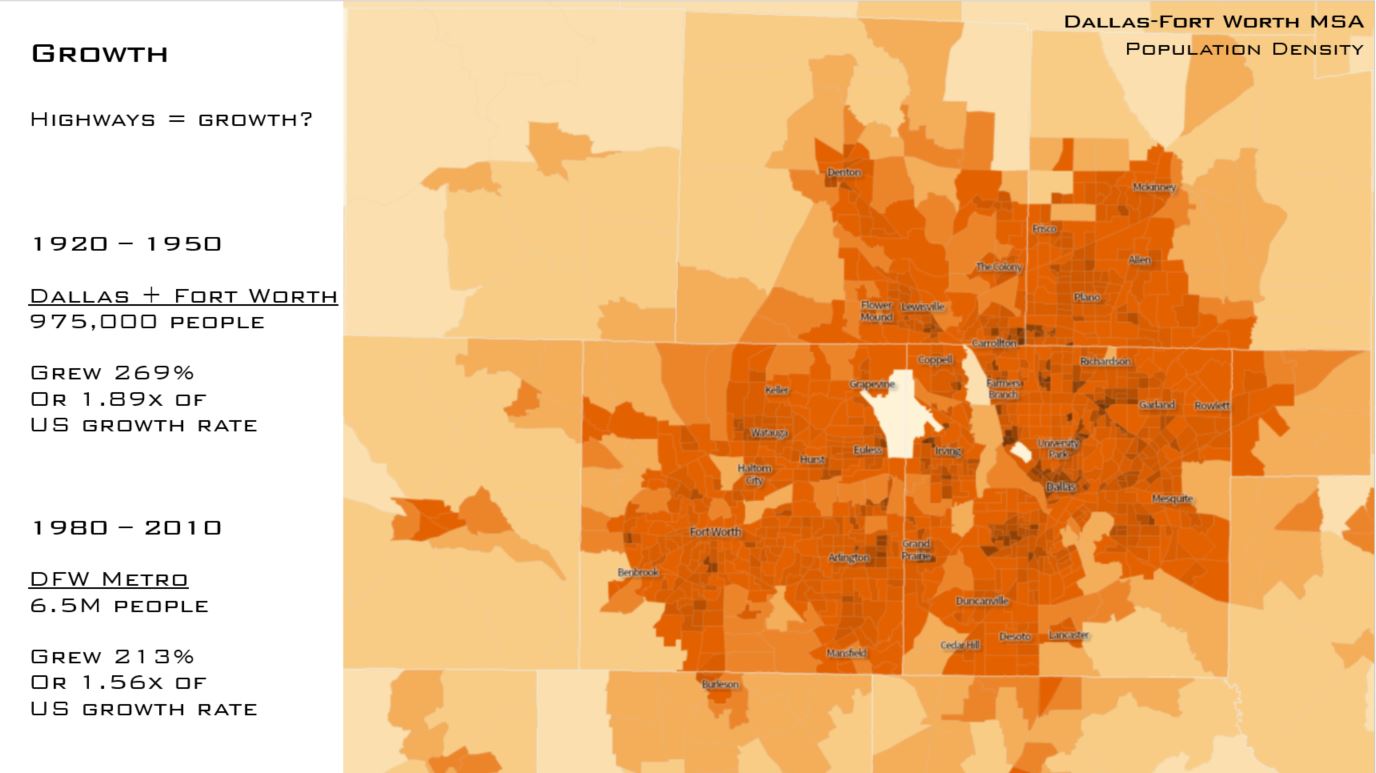
Comparing the previous information to the thirty years from 1980 (post- 1962 Federal Highway Reauthorization Bill that created regional planning organizations to remove the role of local politics in preventing introduction of highways into existing inner-city neighborhoods, which led to an inner-city highway building boom around the country in the 1970’s) to 2010. From a population growth standpoint, we’ve actually grown more slowly despite the hyperbole surrounding DFW hyper-growth. We’ve sprawled. We’ve grown quantitatively in terms of land area, but not qualitatively. We are Augustus Gloop.
If causation rather than correlation is the question here I submit the following chart comparing more than 100 US metros in terms of Highway Lane Miles/Capita to Daily VMT/Capita:
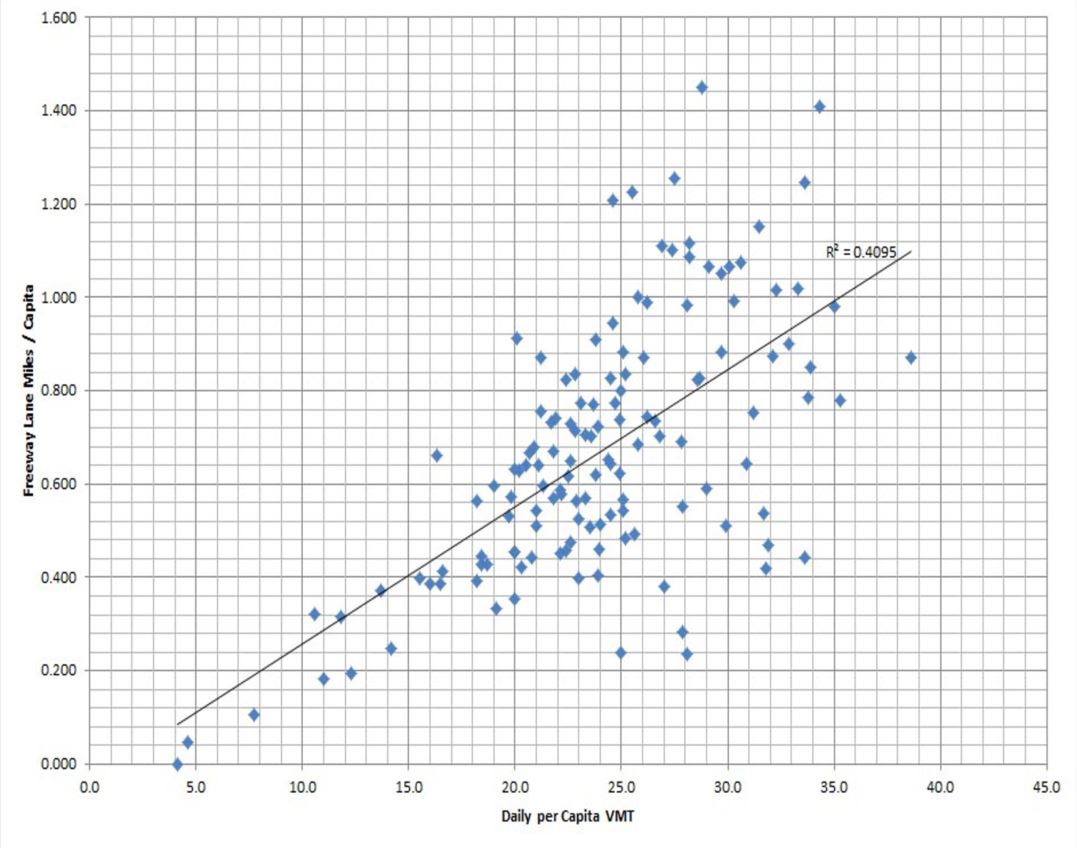
The more highways we build (the more the public sector spends), the more people drive (the more the private sector spends) in order to make all the same trips we could be making in more efficient, healthful, and beneficial ways than what we currently are doing.